ProteinPaint Tool
Introduction to ProteinPaint
ProteinPaint visualizes cancer coding somatic mutations in an interactive lollipop plot. For a given gene, it displays GDC cancer mutations associated with that gene as well as genomic position, consequence, and occurrence for each mutation. Information including disease type and demographic of the mutated cases are also accessible.
Quick Reference Guide
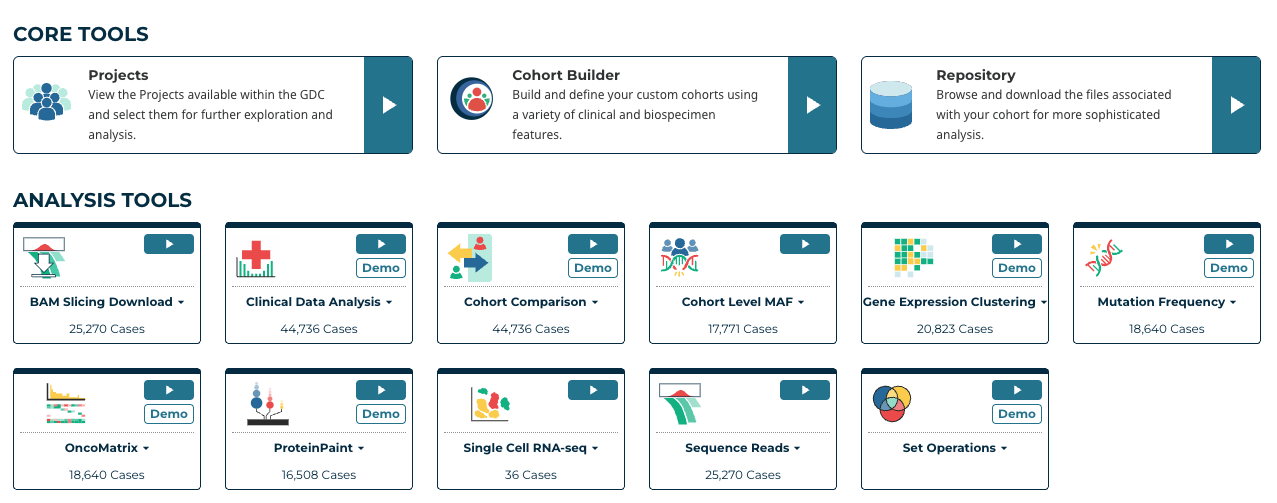
At the Analysis Center, click on the 'ProteinPaint' card to launch the app.
Users can view publicly available variants as well as login with credentials in order to access controlled data.
When launched, ProteinPaint will display a search box where users can enter a gene symbol, alias, or GENCODE accession. Once a gene is entered, a lollipop frame is displayed with the name of the chart in the header.
In addition to the search box, there are two other main panels in the ProteinPaint tool: Lollipop chart, and legend.
Lollipop Chart Panel
After entering a gene, the tool will display a Lollipop chart for the GDC variants as well as a Protein View for the default isoform.
In the Lollipop chart, the circular discs for each variant are color coded per GDC mutation classes and are proportional in size to the number of occurrences. Variants in the same position are arranged in descending order of occurrences.
Exon variants report the amino acid change at the referenced codon. For example, G12D is a G > D substitution at the 12th codon of the protein.
The default isoform will appear directly to the right of the gene name. Clicking on the isoform number will open a display to view/select other isoforms and switch the display track.
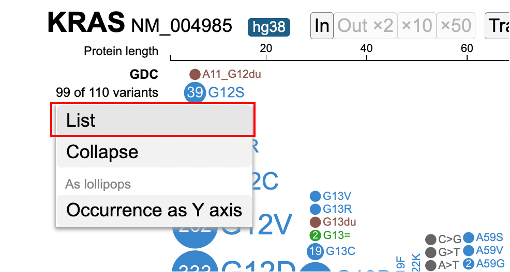
Clicking on the number of variants link, to the left of the plot, opens a menu where users can view annotations and manipulate the Lollipop:
- List: Displays all variants, each of which can be selected to launch the annotation table which displays consequence, mutation, sample submitter_id, and other data related to the sample
- Mutation: Launches the GDC Mutation Summary Page
- Sample: Launches the GDC Case Summary Page. Users also have the ability to create a new cohort or launch the Disco plot.
- Collapse/Expand: Collapses or expands all skewers in the lollipop
- Download: Downloads the mutations in a TXT file
- As lollipops: Displays variants via circular discs proportional to the number of occurrences
- Occurrence as Y axis: Sorts variants on the y-axis by number of occurrences
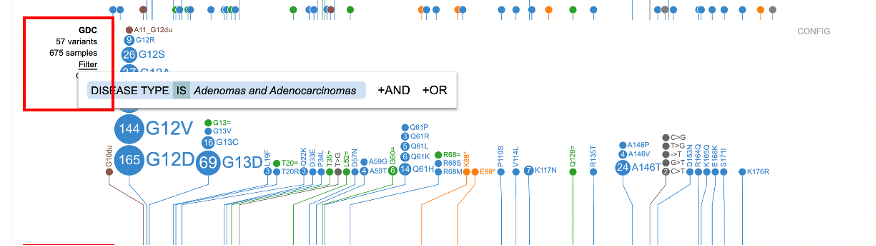
Clicking on the number of samples opens a window to view annotations grouped by GDC case properties such as disease type and primary site. Selecting a value adds a new Lollipop subtrack that displays only the samples with the given value. This side-by-side view allows for a comparison between the mutations in the main track versus the subtrack.
Each subtrack offers advanced filtering for users to narrow down particular features. Clicking on the value to the right of the Lollipop launches a pop-up window where users can add subsequent filters using the +AND or +OR options.
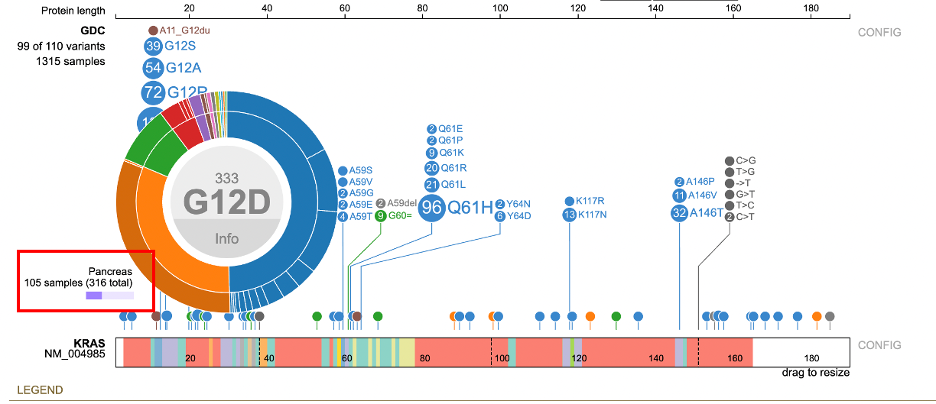
Detailed variant annotation is viewable by clicking on the disc next to the variant label. The sunburst chart is composed of a ring hierarchy, arranged by disease types then broken down by primary sites.
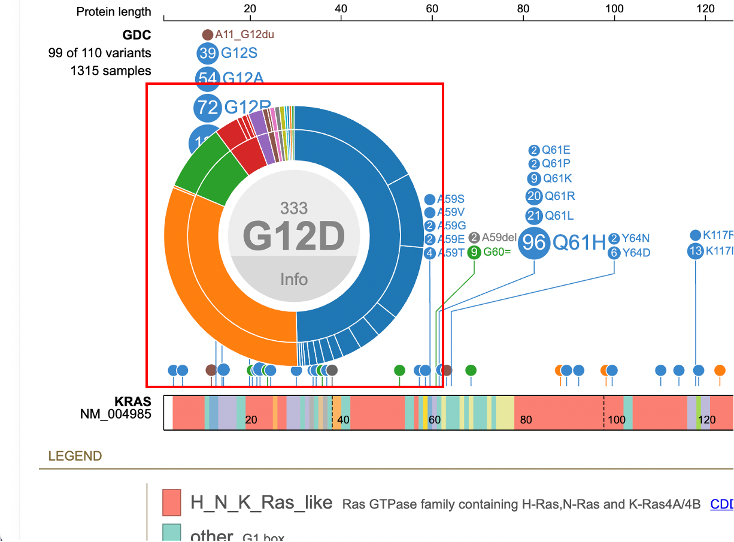
Hovering over the inner and outer rings displays the disease type or primary site, number of samples, and cohort size.
An aggregate table displaying all the samples associated with that variant is available by clicking the 'Info' button in the center of the sunburst.
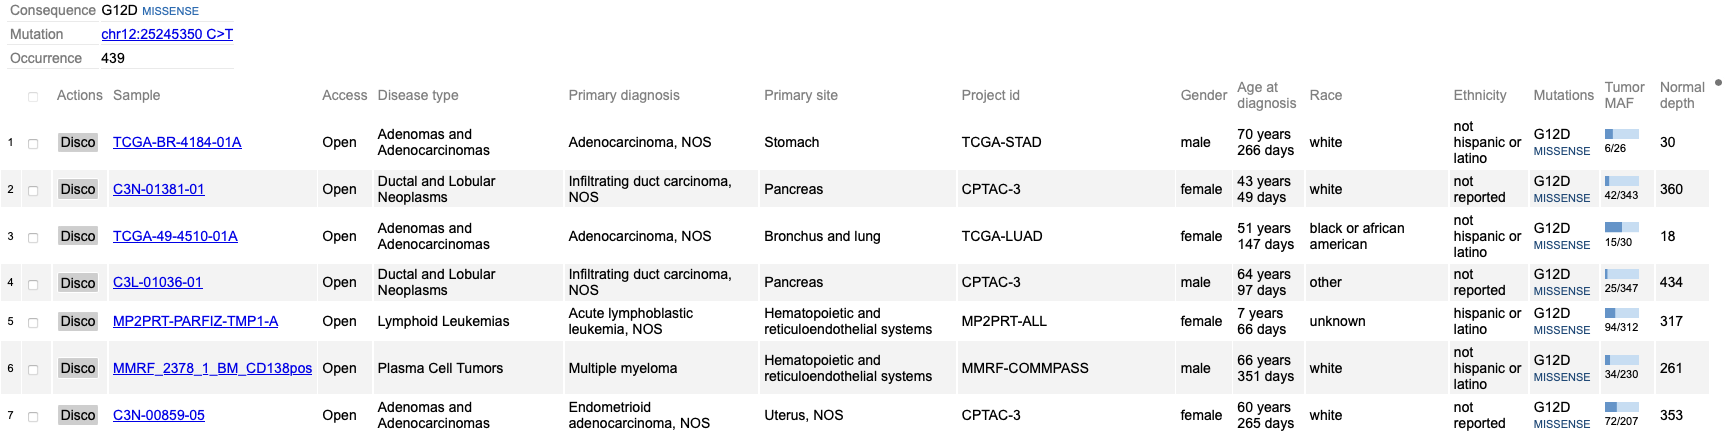
The top of the table displays consequence, mutation, and occurrence count with a link to the GDC Mutation Summary Page.
The sample table contains a number of columns for various associated features per sample such as Disease type, Mutations, and Tumor DNA Mutant Allele Frequency. Users can create a new cohort by selecting the checkboxes in the first column then clicking 'Create Cohort' in the bottom right corner of the table. The table also includes options to launch the Disco plot and the GDC Case Summary Page for each sample.
Protein View
The Protein View, which displays the nucleotides, codons in the exon region, introns, and protein domains, is the primary area in which a user will visualize and interact with protein coding regions.
Legend Panel
Protein Domains
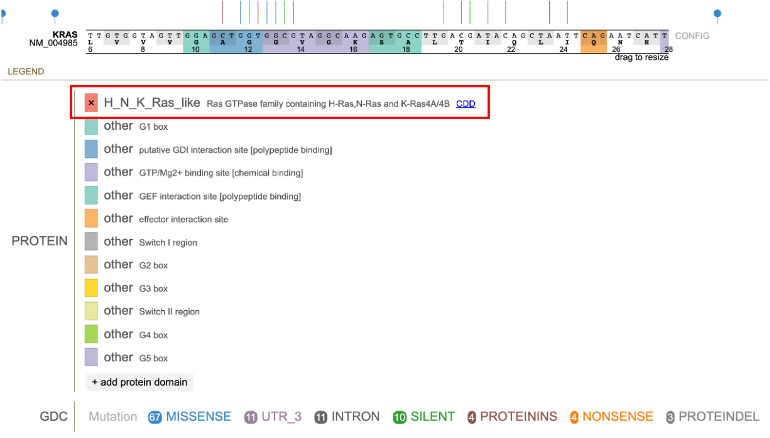
The Protein View color codes regions by the protein domain present on the full-length protein region in the exon display.
The legend offers simple filtering for the variants shown in the lollipop. To the right of PROTEIN, users can click on the color to hide that particular protein domain. Clicking on the color again shows the protein domain.
Custom protein domains are added by clicking on the + add protein domain button at the bottom of the list. An input box appears requiring the following information:
- Name, text with space, no semicolon: Name of the protein domain
- Range, two integers joined by space: Codon position - start and stop
- Color (e.g., red, #FF0000, rgb (255,0,0)): Color to assign to the protein domain
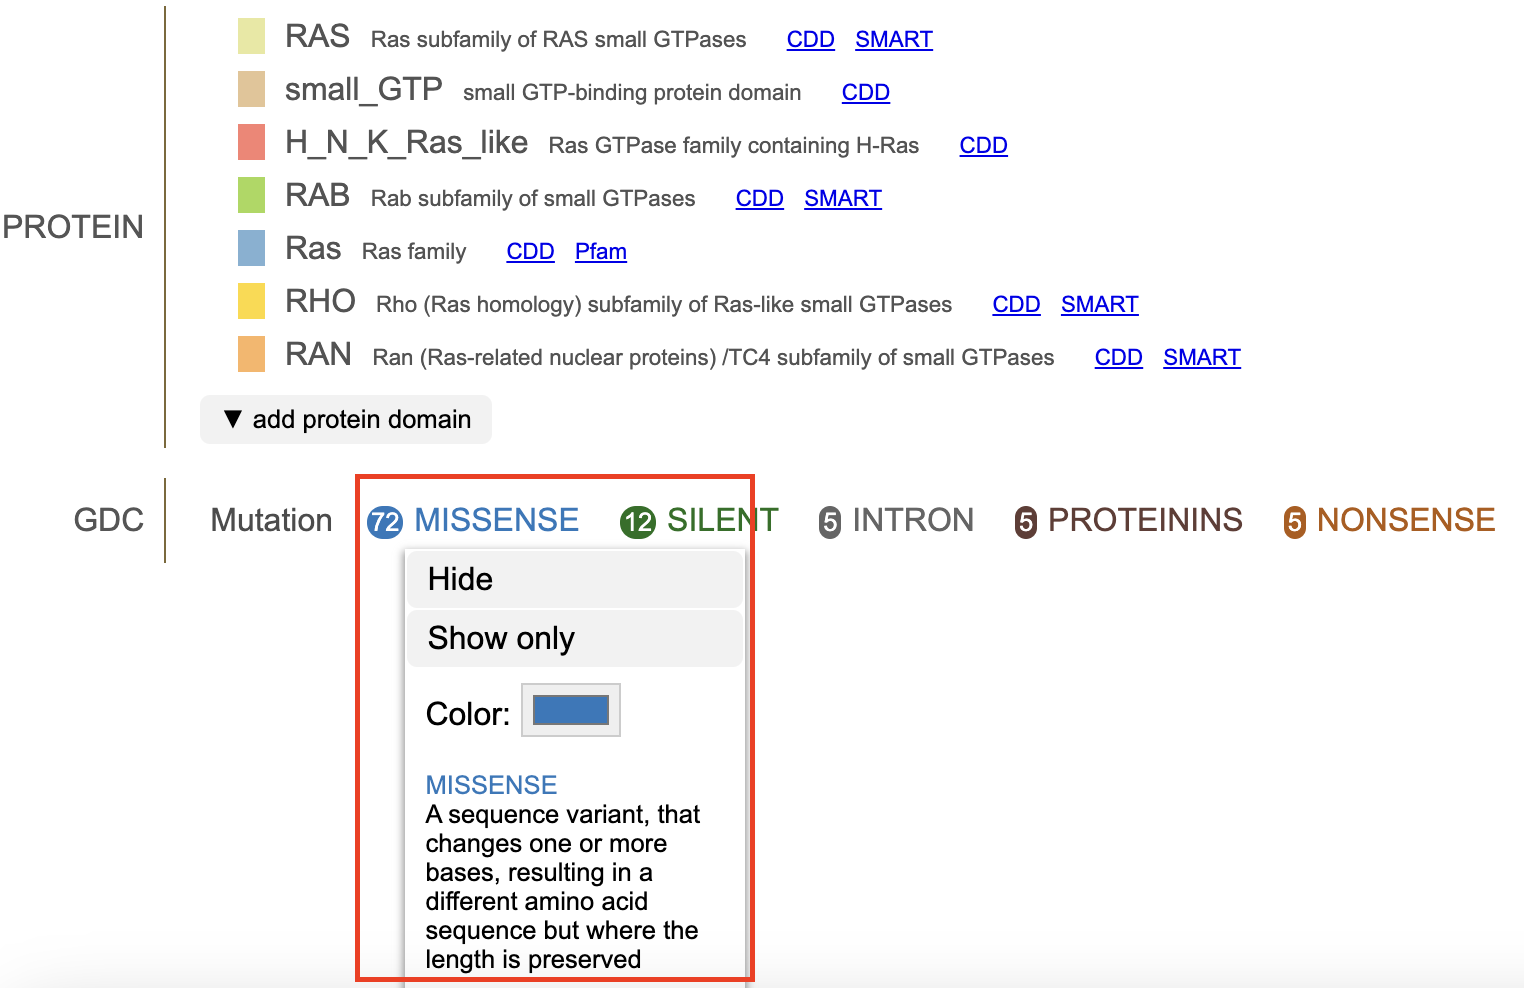
The protein domains also include links to databases of protein families such as the Conserved Domains Database (CDD), Simple Modular Architecture Research Tool (SMART), and Pfam.
GDC Mutation Class
The GDC mutation class color coding for the lollipop discs appears below the legend for the protein domains.
Clicking on a mutation class opens a pop-up menu with show/hide functionalities:
- Hide: Remove all of the lollipop discs for the particular mutation class
- Show only: Only show the lollipop discs for the particular mutation class
- Show all: Display the lollipop discs for all mutation classes
The color selector in the pop-up menu allows users to customize consequence colors.
Additional Features
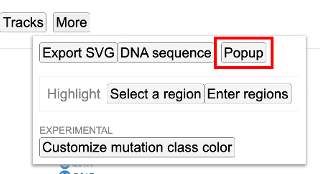
In the toolbar, the More button offers methods to download figures and data:
- Export SVG: Download the Lollipop and legend as an SVG file
- Reference DNA Sequence: Display the DNA sequence as plain text for easy copying and pasting
- Highlight: Highlight a region in the Lollipop by selecting it in the chart or entering it in a text box
ProteinPaint Features
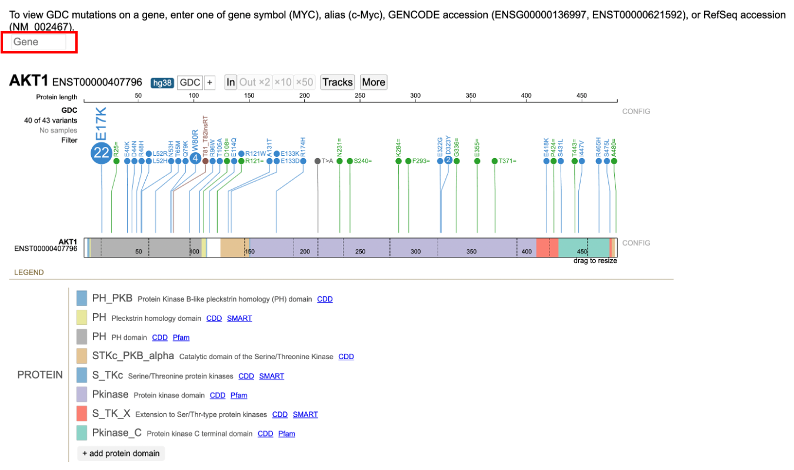
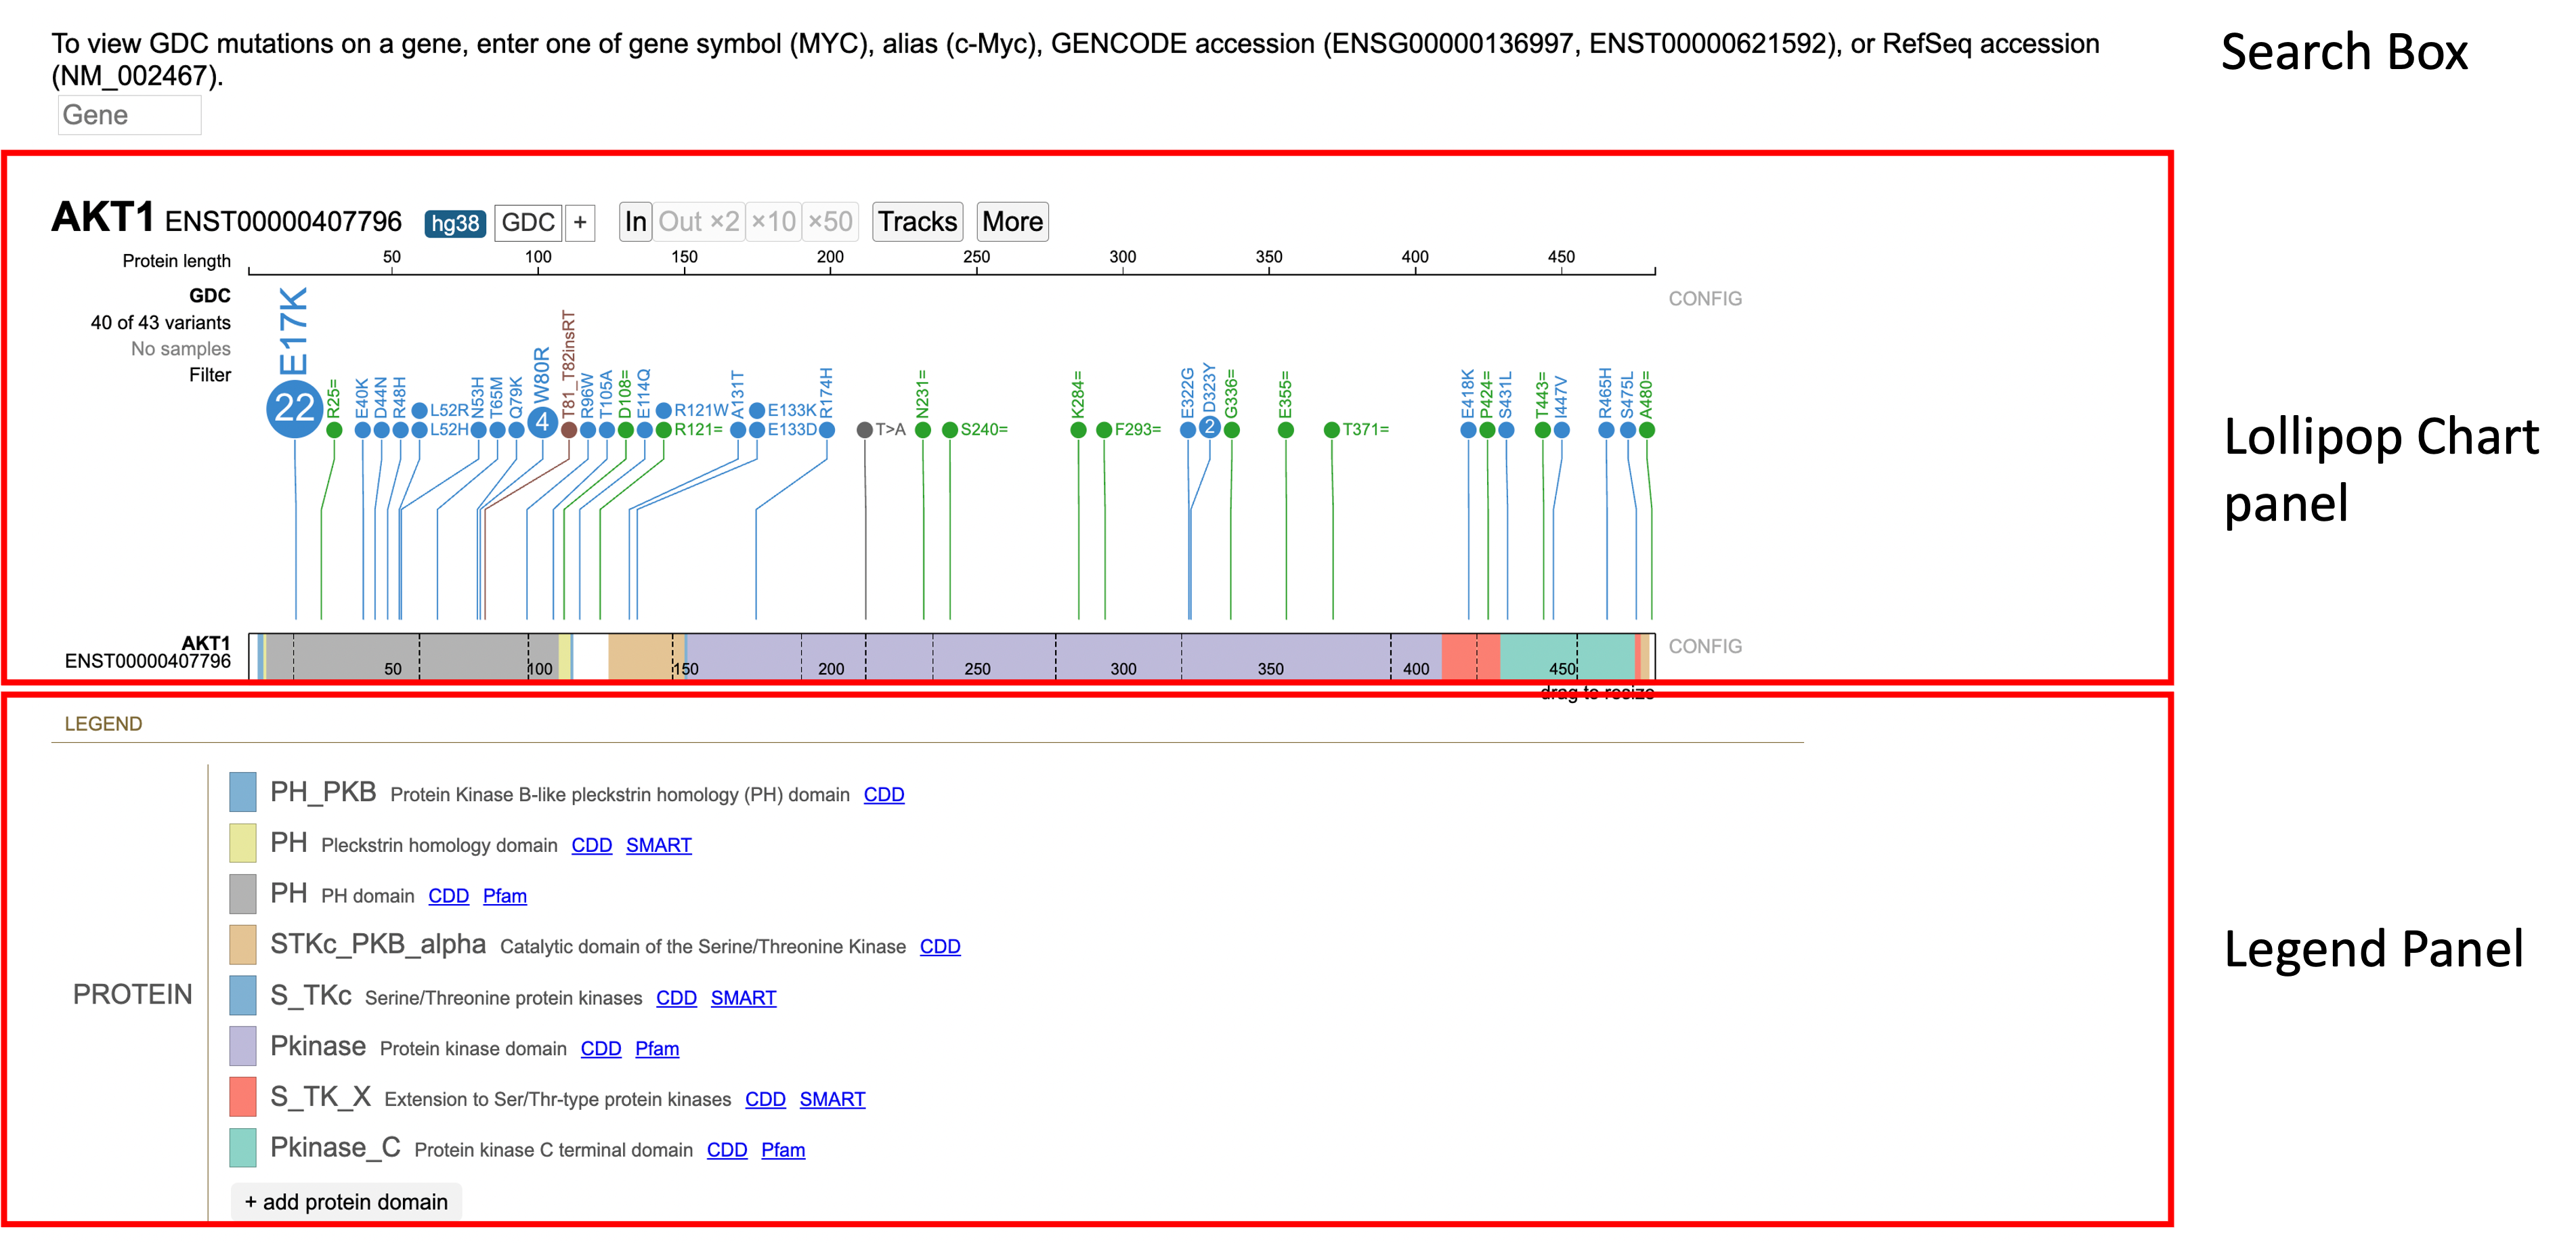
When selected, ProteinPaint will display the search-box as illustrated below. Once a user enters a gene symbol, alias, or GENCODE accession, a lollipop frame is displayed with the name of the chart in the header. The example below is of the gene AKT1. All gene symbols are based on the HGNC guidelines.
There are 3 main panels as outlined in the figure below:
- Search box
- Lollipop chart panel
- Legend panel
Search Box

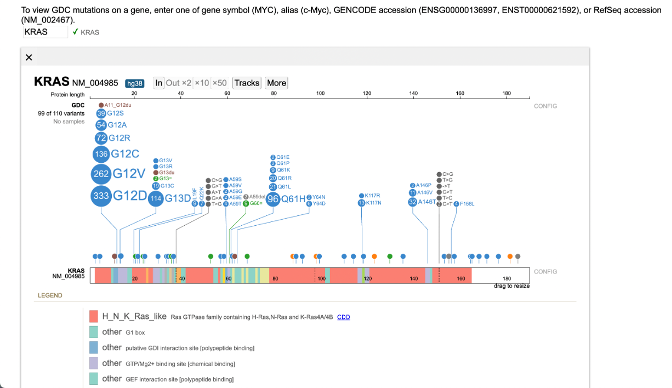
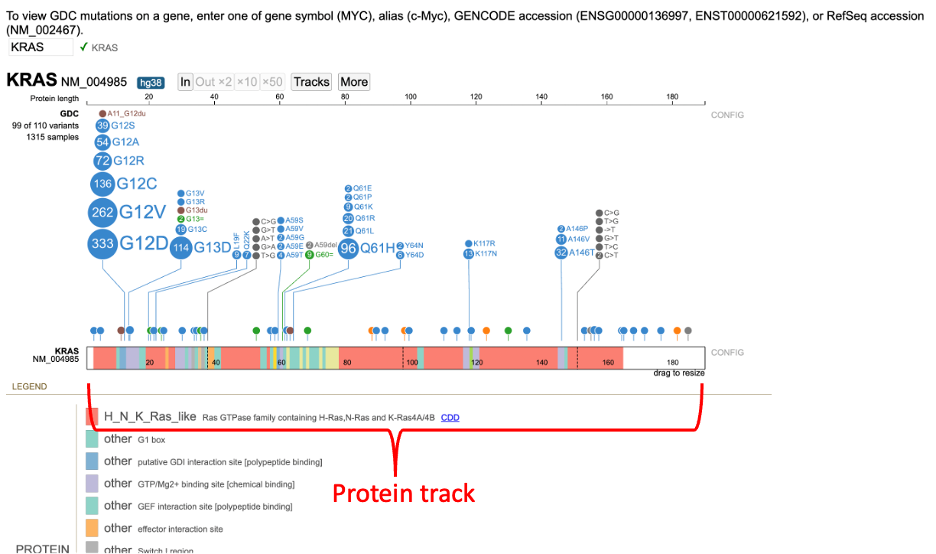
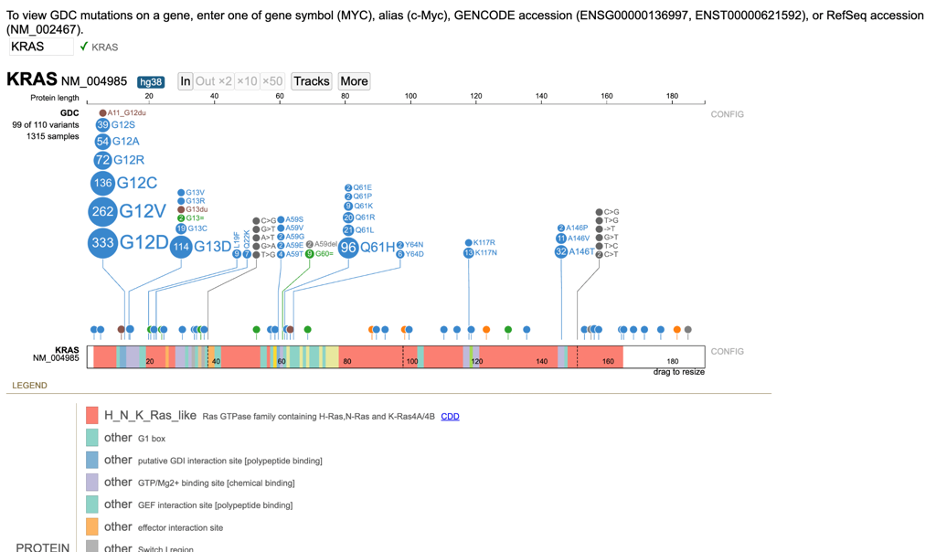
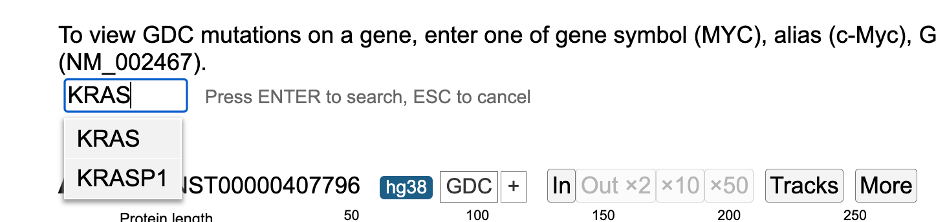
The example below uses the KRAS gene. The name of the gene (e.g., 'KRAS'), GENCODE accession no. (e.g., ENST00000311936, ENSP00000308495) or RefSeq accession (e.g., NM_004985) can be used as the search item. In case a wrong gene is entered, the search box will display an error. For gene searches only, typing a few letters reveals a menu of possible matches. Choose from either a menu option or hit enter.
Lollipop Chart Panel
Protein View
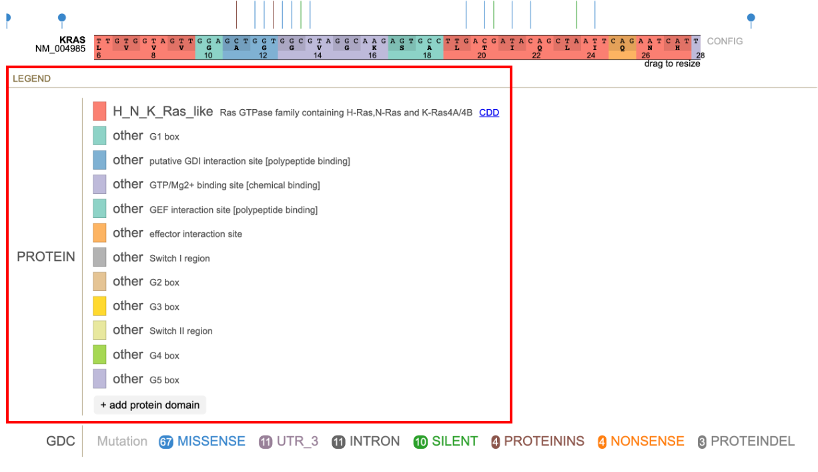
After searching for KRAS, the Protein View for the default isoform appears in a new frame. The Protein View displays the nucleotides, codons in the exon region, introns, and protein domains as shown below.
The legend offers simple filtering for the variants showing in the lollipop. Clicking the color for a protein domain on the right of PROTEIN for example, hides that protein domain. Clicking on the color again shows the protein domain. Similar show/hide functions are available by clicking on the legend labels.
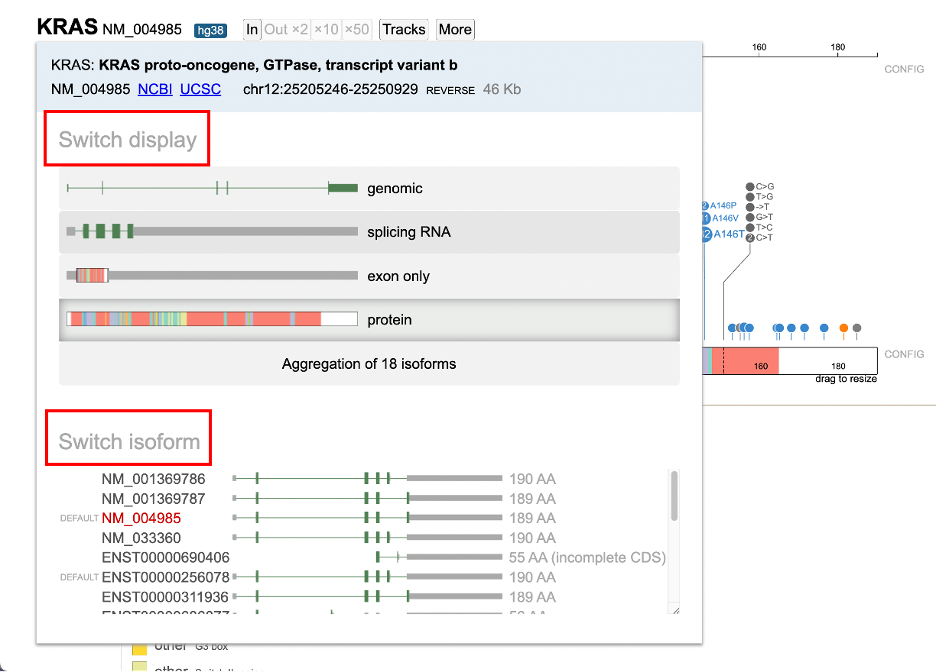
The default isoform for KRAS on hg38 genome build is NM_004985. Hovering over the isoform label will highlight it as shown below.
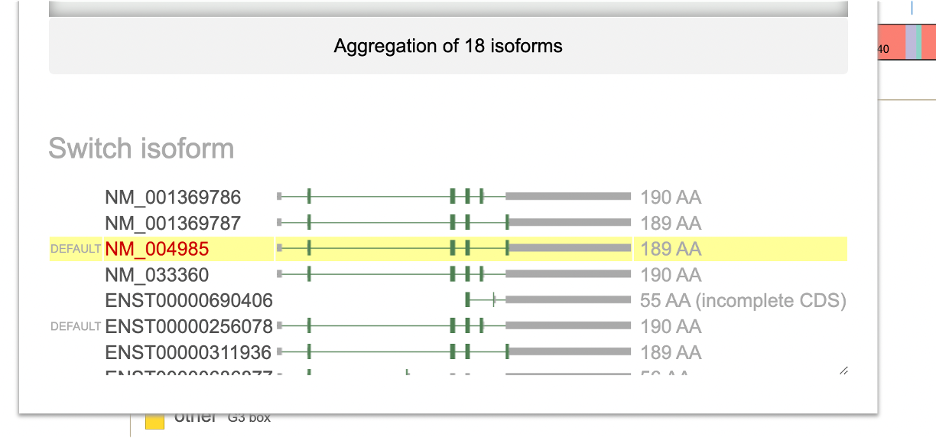
A user can select the isoform by clicking on the isoform number as shown in the figure above. Clicking this will open a display to view all the other isoforms as well as the option to switch the display track as shown below in the figure.
From Switch Display, a user can update to one of the following: 1. Genomic display 2. Splicing RNA 3. Exon only 4. Protein track 5. Aggregate of all isoforms
The Protein track is the primary area in which a user will visualize and interact with protein coding regions.
Protein Track
Under Switch Isoform, the available RefSeq and Ensembl isoform builds are listed. A condensed display and the protein length is shown for each isoform. The current selection appears in red text. The default KRAS isoform for example, is NM_004985 with 189 amino acids. To change the isoform, click on the appropriate line highlighted in yellow.
The pop-up window disappears and the lollipop track rerenders with the newly selected isoform.
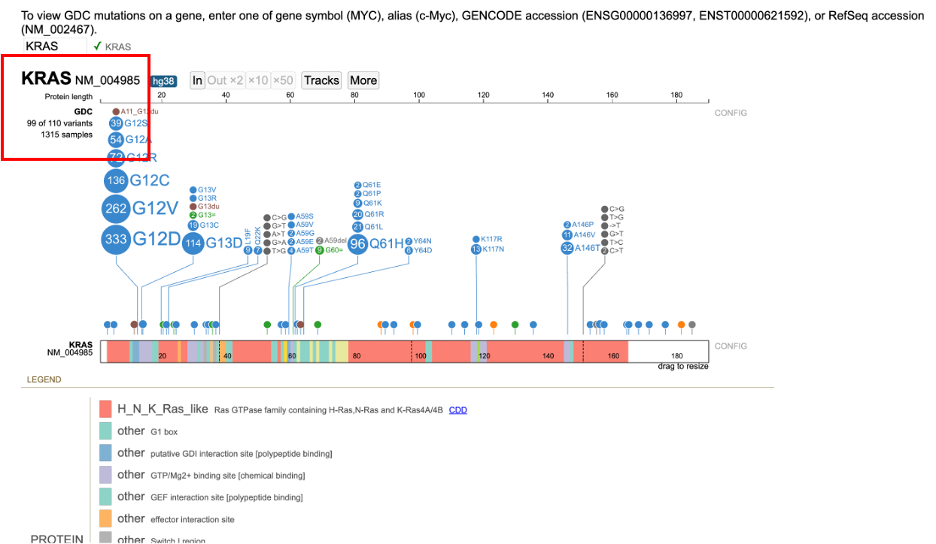
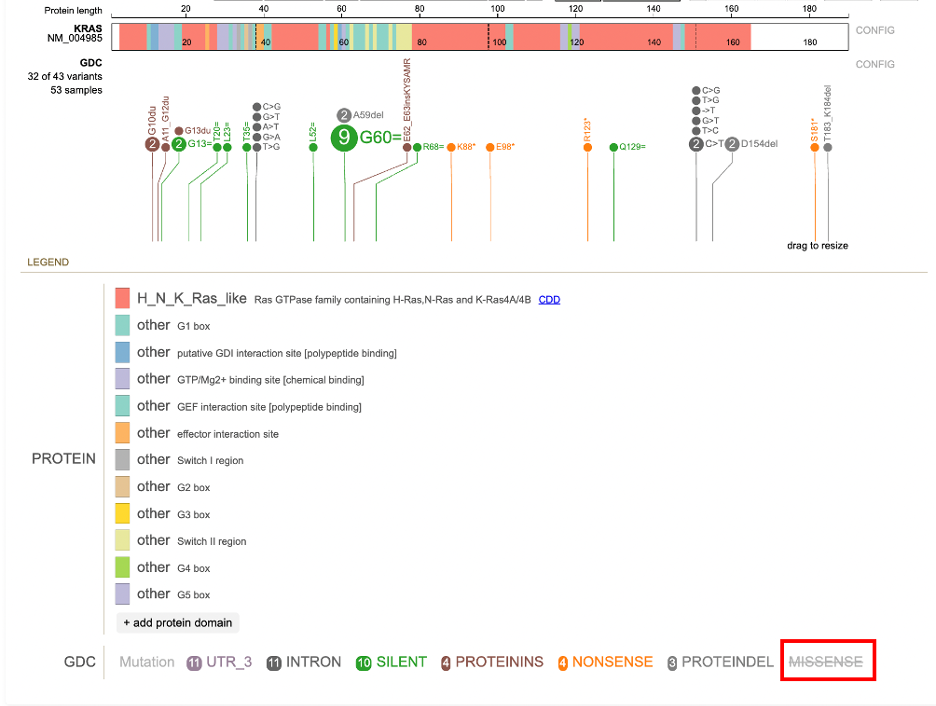
Lollipop Charts
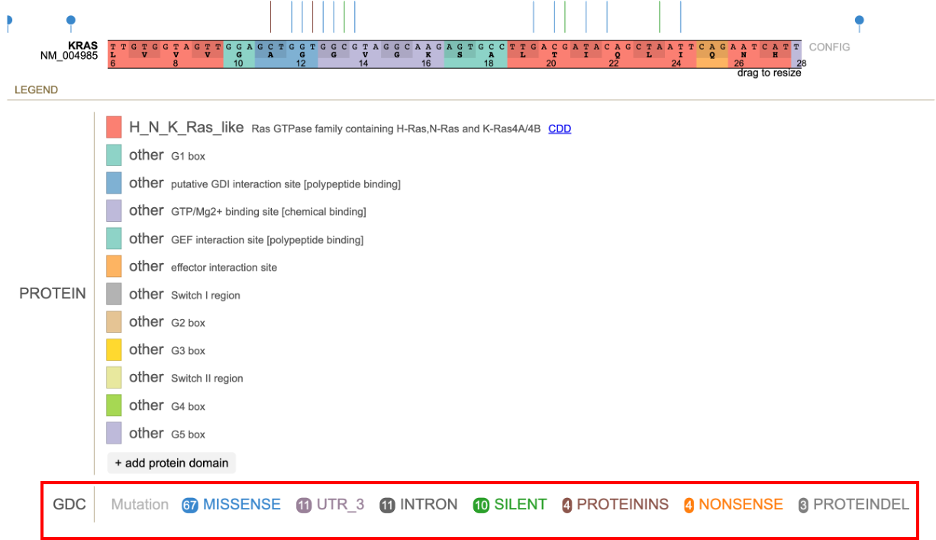
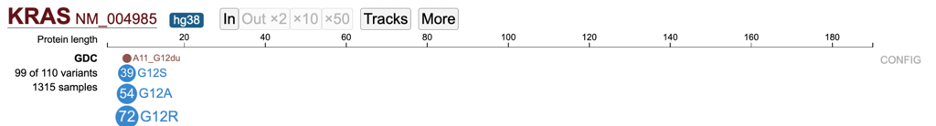
The lollipop chart for the GDC variants appears above the Protein View. The circular disc for each variant is proportional to the number of occurrences. Variants in the same position are arranged in descending order of magnitude. There are eight types of variants found in the lollipop chart (see legend).
Exon variants report the amino acid change at the referenced codon. For example, G12D is a G > D substitution at the 12th codon of the protein.
Clickable links for the number of cases (e.g. 1315 samples) and number of variants (e.g. 99 out of 110 variants) appear to the left of the lollipop. Clicking on these links reveals detailed annotations about the samples and variants, described in the next section "Viewing Variants and Case Samples".
Viewing Variants and Case Samples
Variant Annotations and Chart Manipulation
Click on the number of variants linked to the left of the lollipop for viewing annotations and manipulating the lollipop. For variant annotation, click on 'List'.
A pop-up window appears with the entire list of variants, as shown below.
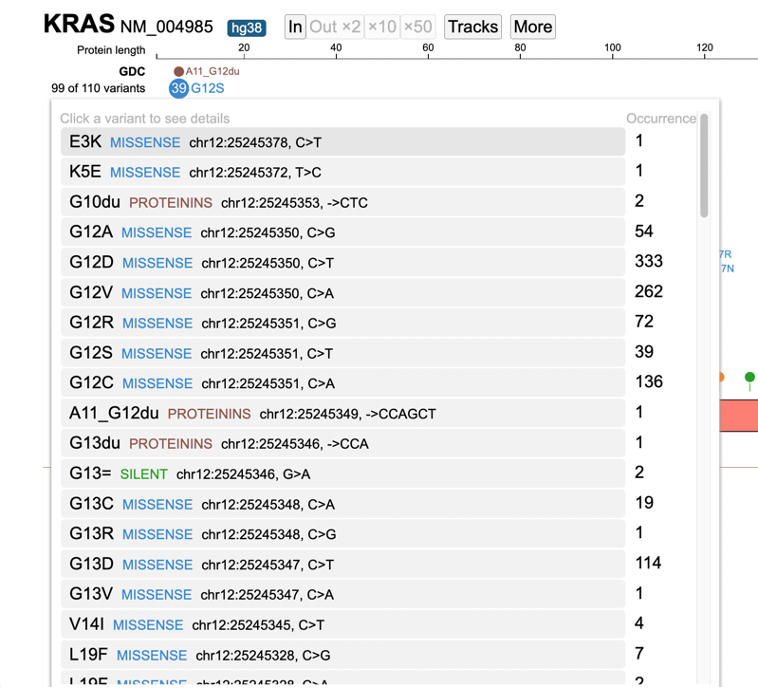
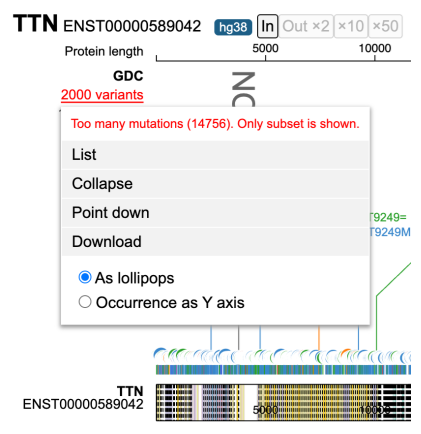
Lollipop plot limits up to 2000 variants. When this limit is exceeded, the number of variants label is in red; click the label to see an alert message.
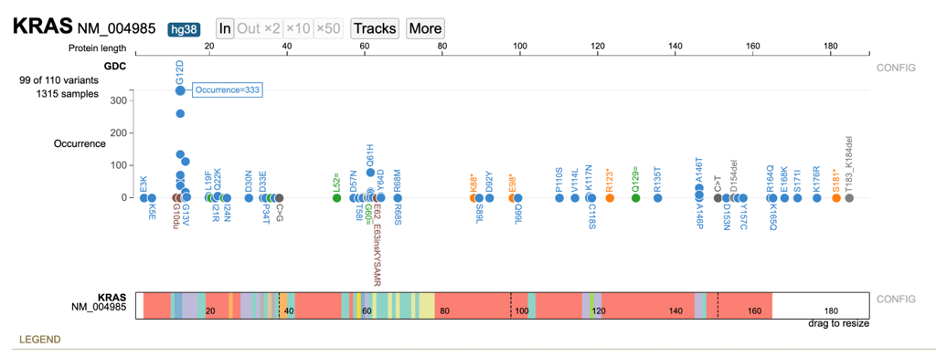
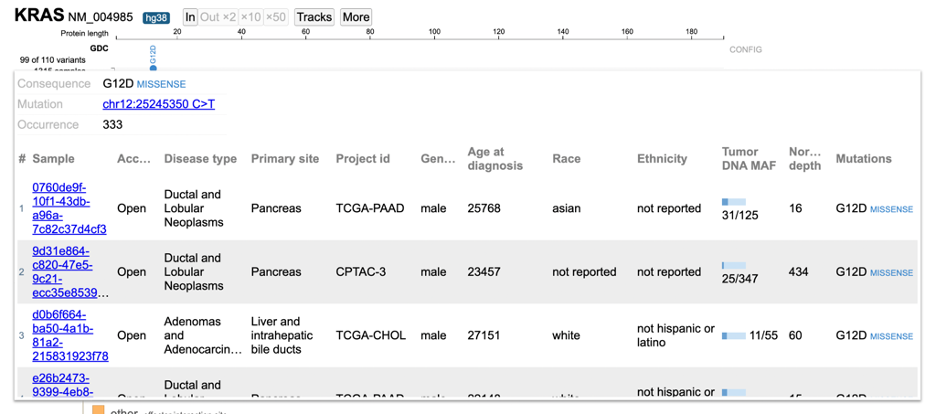
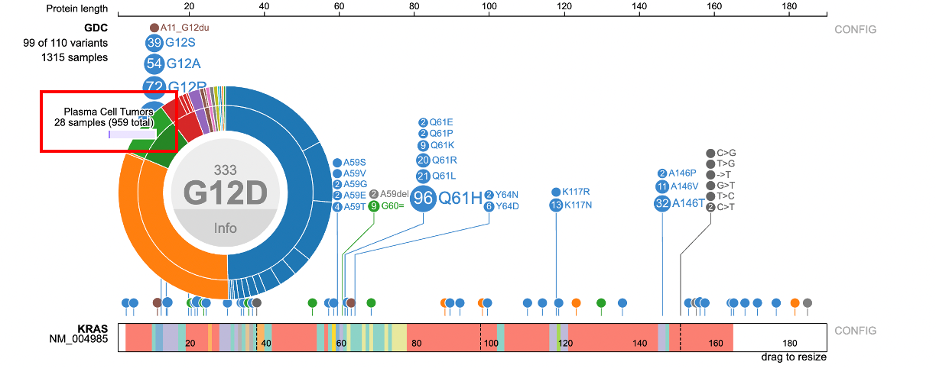
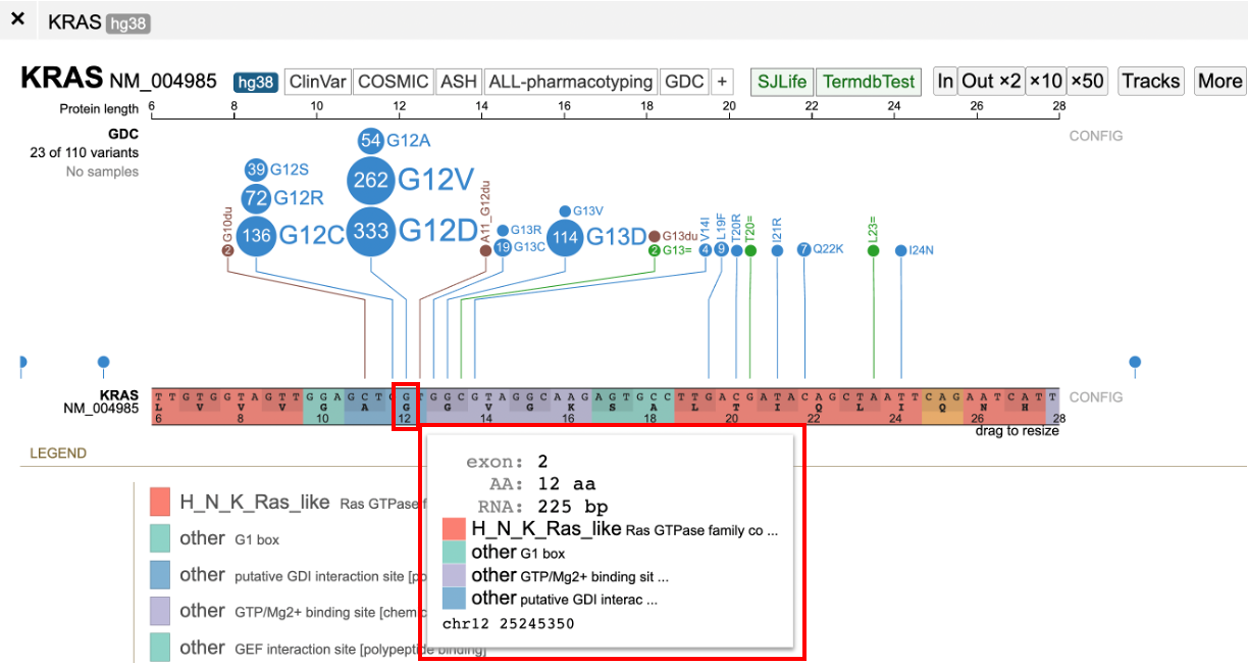
Click on the variant of interest and a new annotation table appears. From the table, view various associated features per sample such as: Disease type, Primary site, Project id, Gender, Race, Ethnicity, and Tumor DNA Mutant Allele Frequency (MAF). In the figure below, 333 occurrences are shown for the G12D variant, which represents a missense mutation at chromosome chr12:25245350 C>T.
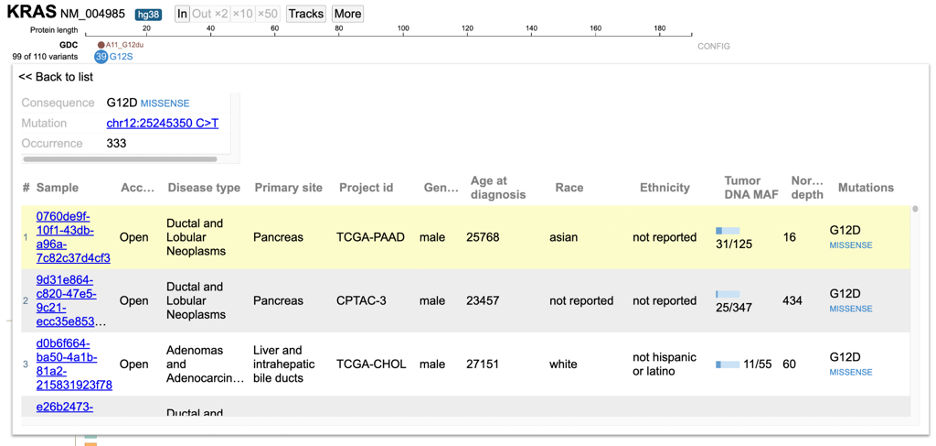
The first sample that is highlighted in yellow is a male with ductal and lobular neoplasms with a tumor DNA MAF of 31/125. This indicates 31 mutant alleles were found out of 125 total alleles.
The GDC dataset includes an 'Access' column to indicate whether the data is controlled or open. Users must obtain permission from dbGaP to view controlled data See Obtaining Access to Controlled Data. Click on the sample hyperlink and the GDC's case summary for the sample will appear in a new tab.
Click 'Back to list' and select another sample, as shown below.
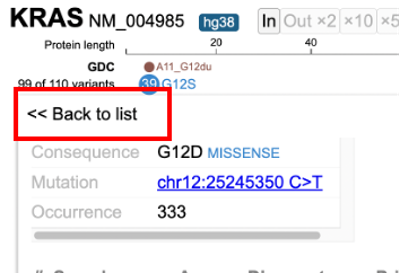
After clicking on the variant menu again, select the 'Collapse' option to collapse all skewers in the lollipop.
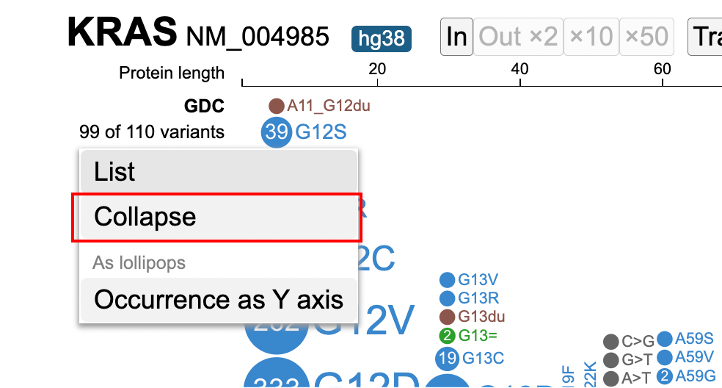
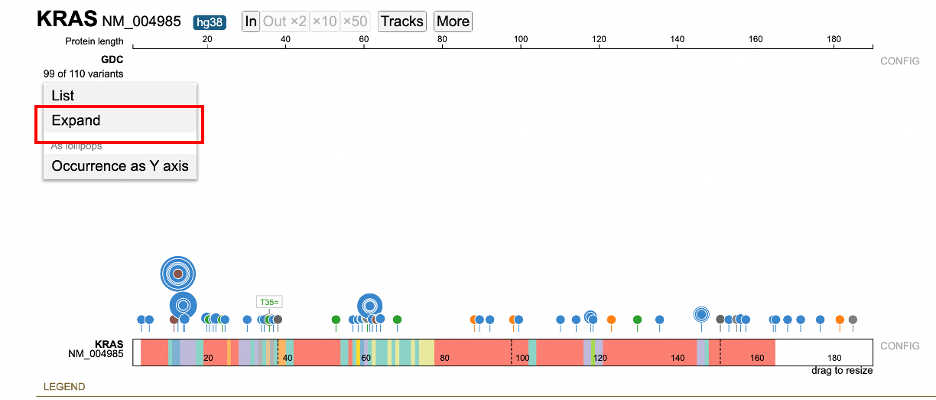
To expand any previously collapsed skewers, open the variant menu, and click on 'Expand'.
The lollipop chart includes an option to arrange variants by the range of occurrences. Open the variant menu and click on 'Occurrence as Y axis'.
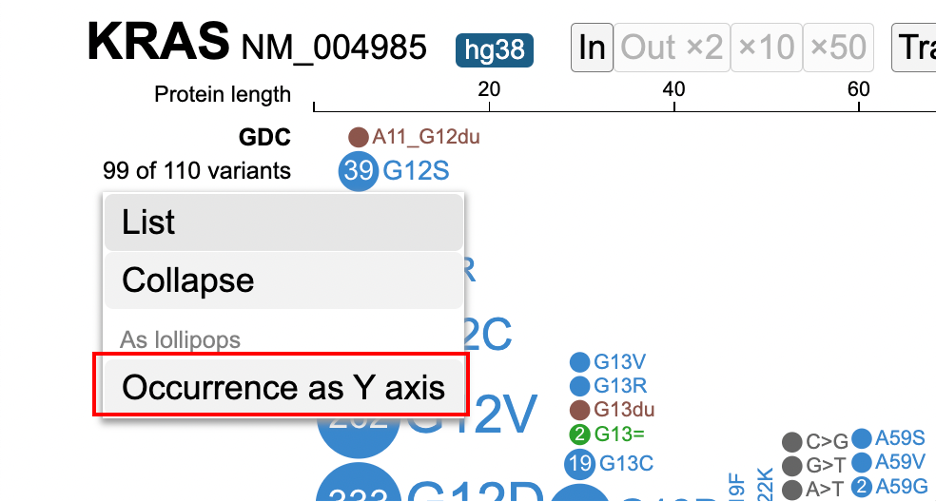
The lollipop re-renders with the variants sorted on the y-axis from lowest and highest occurrence. Hover over a variant to display the number of occurrences. In the example below, a user is hovering over G12D to display 333 occurrences of this variant.
Clicking on the variant loads the sample table again as shown below.
Case Filtering
Clicking on the sample hyperlink on the left of the lollipop (e.g. 1315 samples) opens a menu to list all samples. Aggregate data for all samples by attribute appears in a series of tabs. The ability for advanced filtering and creating subtracks is available from this new display.
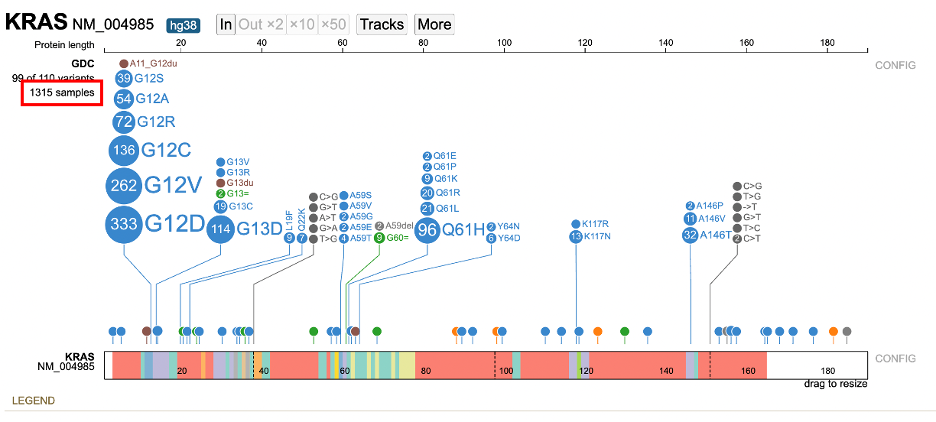
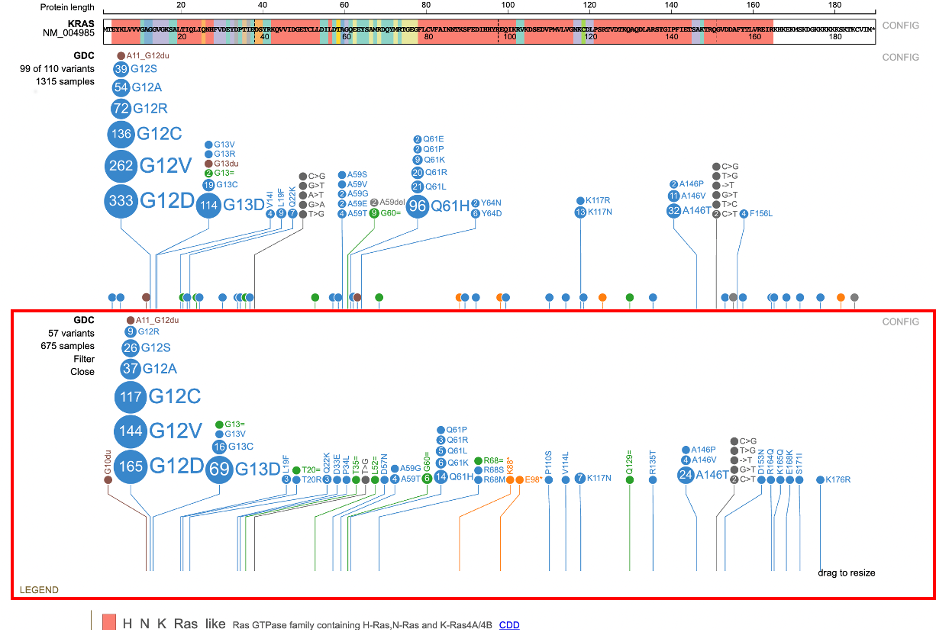
Click on 1315 samples to view annotations grouped by attributes such as: Disease type, Primary site, Project id, Gender, Race, Ethnicity, etc.. For each attribute, the number of values is represented by 'n' to the right of the group label. In the figure below, 21 values for Disease type are reported.
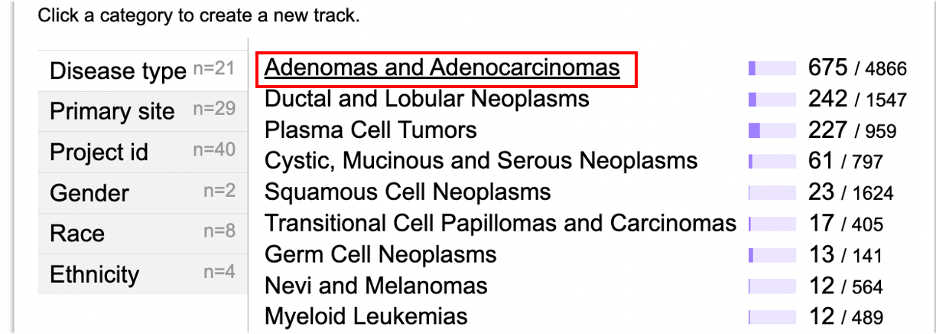
To start filtering, click on the value label or the value's sample fraction. Clicking on 'Adenomas and Adenocarcinomas' or '675/ 4866' for example, loads a new lollipop subtrack underneath the main GDC lollipop track.
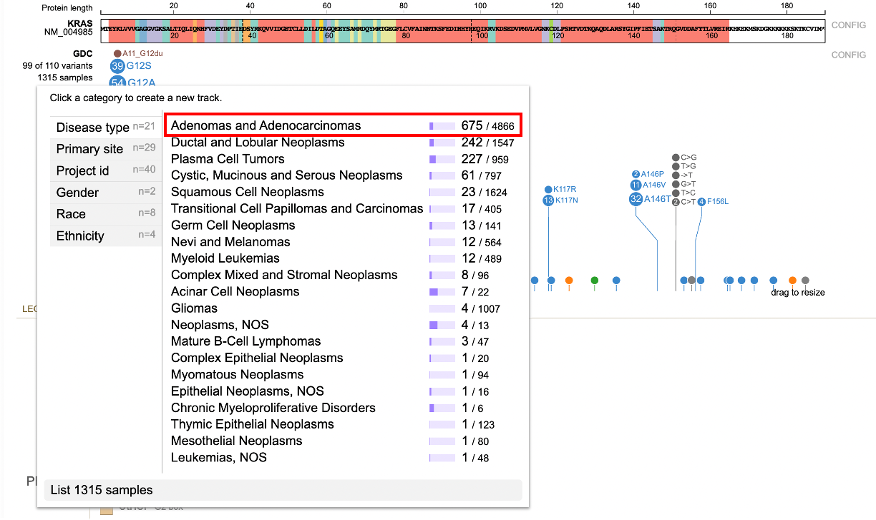
This new subtrack only shows the 675 Adenomas and Adenocarcinomas samples. This side-by-side view allows for a comparison between the mutations in the main track vs the subtrack.
Each subtrack offers advanced filtering, shown below, for users to narrow down particular features.
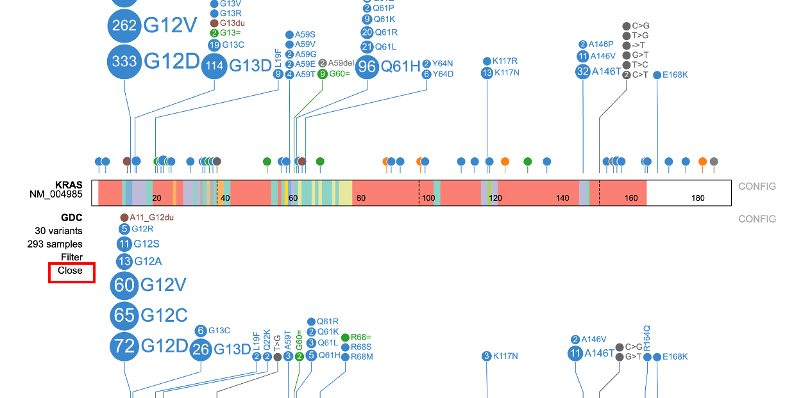
Clicking on 'Filter' displays a pop-up window with the feature the user selected previously from the sample annotation menu (e.g. Disease type: Adenomas and Adenocarcinomas). Clicking on either +AND or +OR will allow further refining the case filtering in the subtrack.
Click on the 'Close' option to remove the subtrack from the page.
Viewing in the Lollipop Display
In the lollipop chart, users can drag the protein track down by clicking the name of the gene on the left of the protein track and pulling it below the lollipop chart.
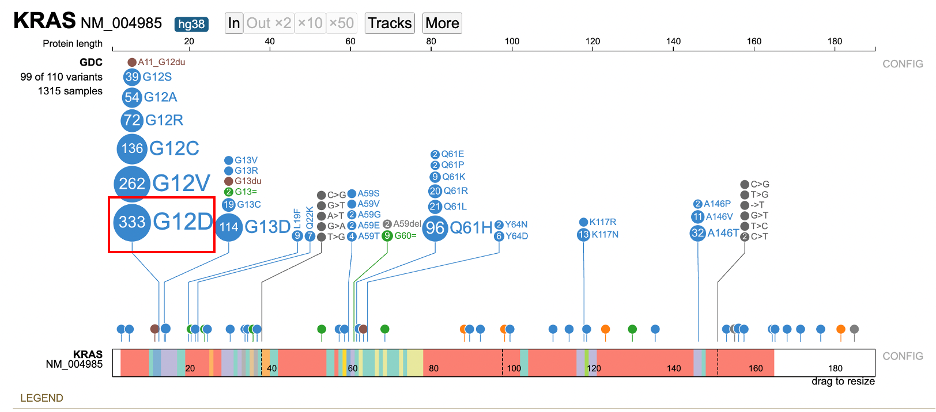
Detailed variant annotation is viewable by clicking on the variant disc next to the label. For G12D highlighted in a red outline in the image above, click on the '333' disc. A sunburst chart will appear, shown below.
The center displays the occurrence of the variant (333) above the variant label. The ring
hierarchy is arranged by disease types then broken down by primary sites. Hovering over the inner ring displays the disease type, number of samples, and cohort size. In this example, the inner green ring displays 'Plasma Cell Tumors' with 28 samples out of a total 949 samples.
The outer ring represents the primary sites. Hovering over the primary site displays the number of samples relative to the disease type. In the figure below, for Ductal and lobular
neoplasms, there are 105 samples with the primary site as pancreas out of 316 total samples.
Clicking on a node displays a sample table for the disease type or primary site. In the figure below, the user selected 'Plasma Cell Tumors'. The sample annotation table appears for all Plasma Cell Tumors.
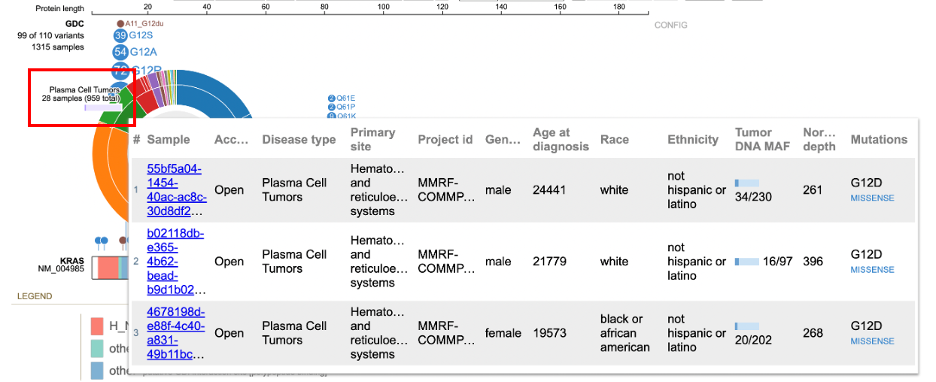
An aggregate sample table is available by clicking the 'Info' button in the center of the sunburst. This displays all the samples associated with that variant.
Clicking on the sample name hyperlink opens a new tab to the sample's GDC Case Summary page.
Clicking on the variant label or anywhere outside of the sunburst removes the sunburst chart.
Working With the Protein Track
There are two zoom methods: highlighting a region and zoom buttons in the toolbar. For viewing a nucleotide of interest, click and drag the mouse in the top, x-axis, Protein length scale. The region appears highlighted in red with the calculated protein length in center.
Once the mouse is released, the lollipop re-renders as the selected region.
The zoom buttons in the toolbar is the second option to zoom in and out based on the center position of the lollipop. For zooming out, users can choose to zoom out 2x, 10x or 50x times.
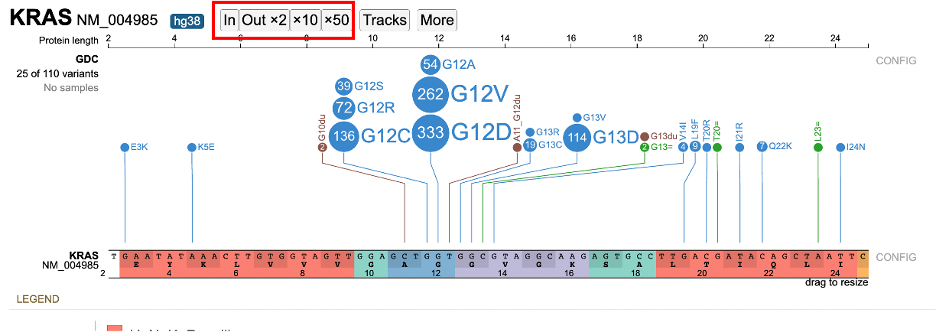
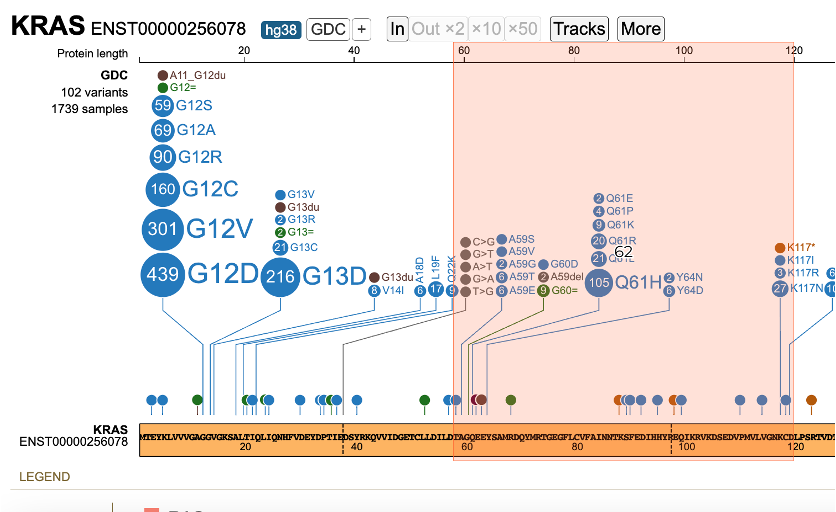
Zooming in causes the protein track to display the codons and the nucleotides as shown below. Hovering over the nucleotide position displays a tooltip with the exon, amino acids position, RNA position, and protein domain. As shown in the image below, at codon 12, the second exon of the transcript, RNA position 225 bp, the reference allele is a 'G'. There is a substitution at 'G' to A, V and D in the KRAS gene for isoform NM_004985 for which the cases are as shown below.
Legend Panel
The protein track color codes regions by the protein domain present on the full-length protein region in the exon display. For KRAS, the protein domains are shown in the red box in the image below.
Protein Domain Legend
Clicking on the colored box next to the protein domain label removes the color from the protein track, as depicted below.
Custom protein domains are added by clicking on the '+add protein domain' button at the bottom of the list. An input box appears requiring the following information: 1. Name, text with space, no semicolon: This is the name of the protein domain 2. Range, two integers joined by space: This is the codon position - start and stop 3. Color (e.g., red, #FF0000, rgb (255,0,0)): This is the color to assign to the protein domain.
GDC Mutations
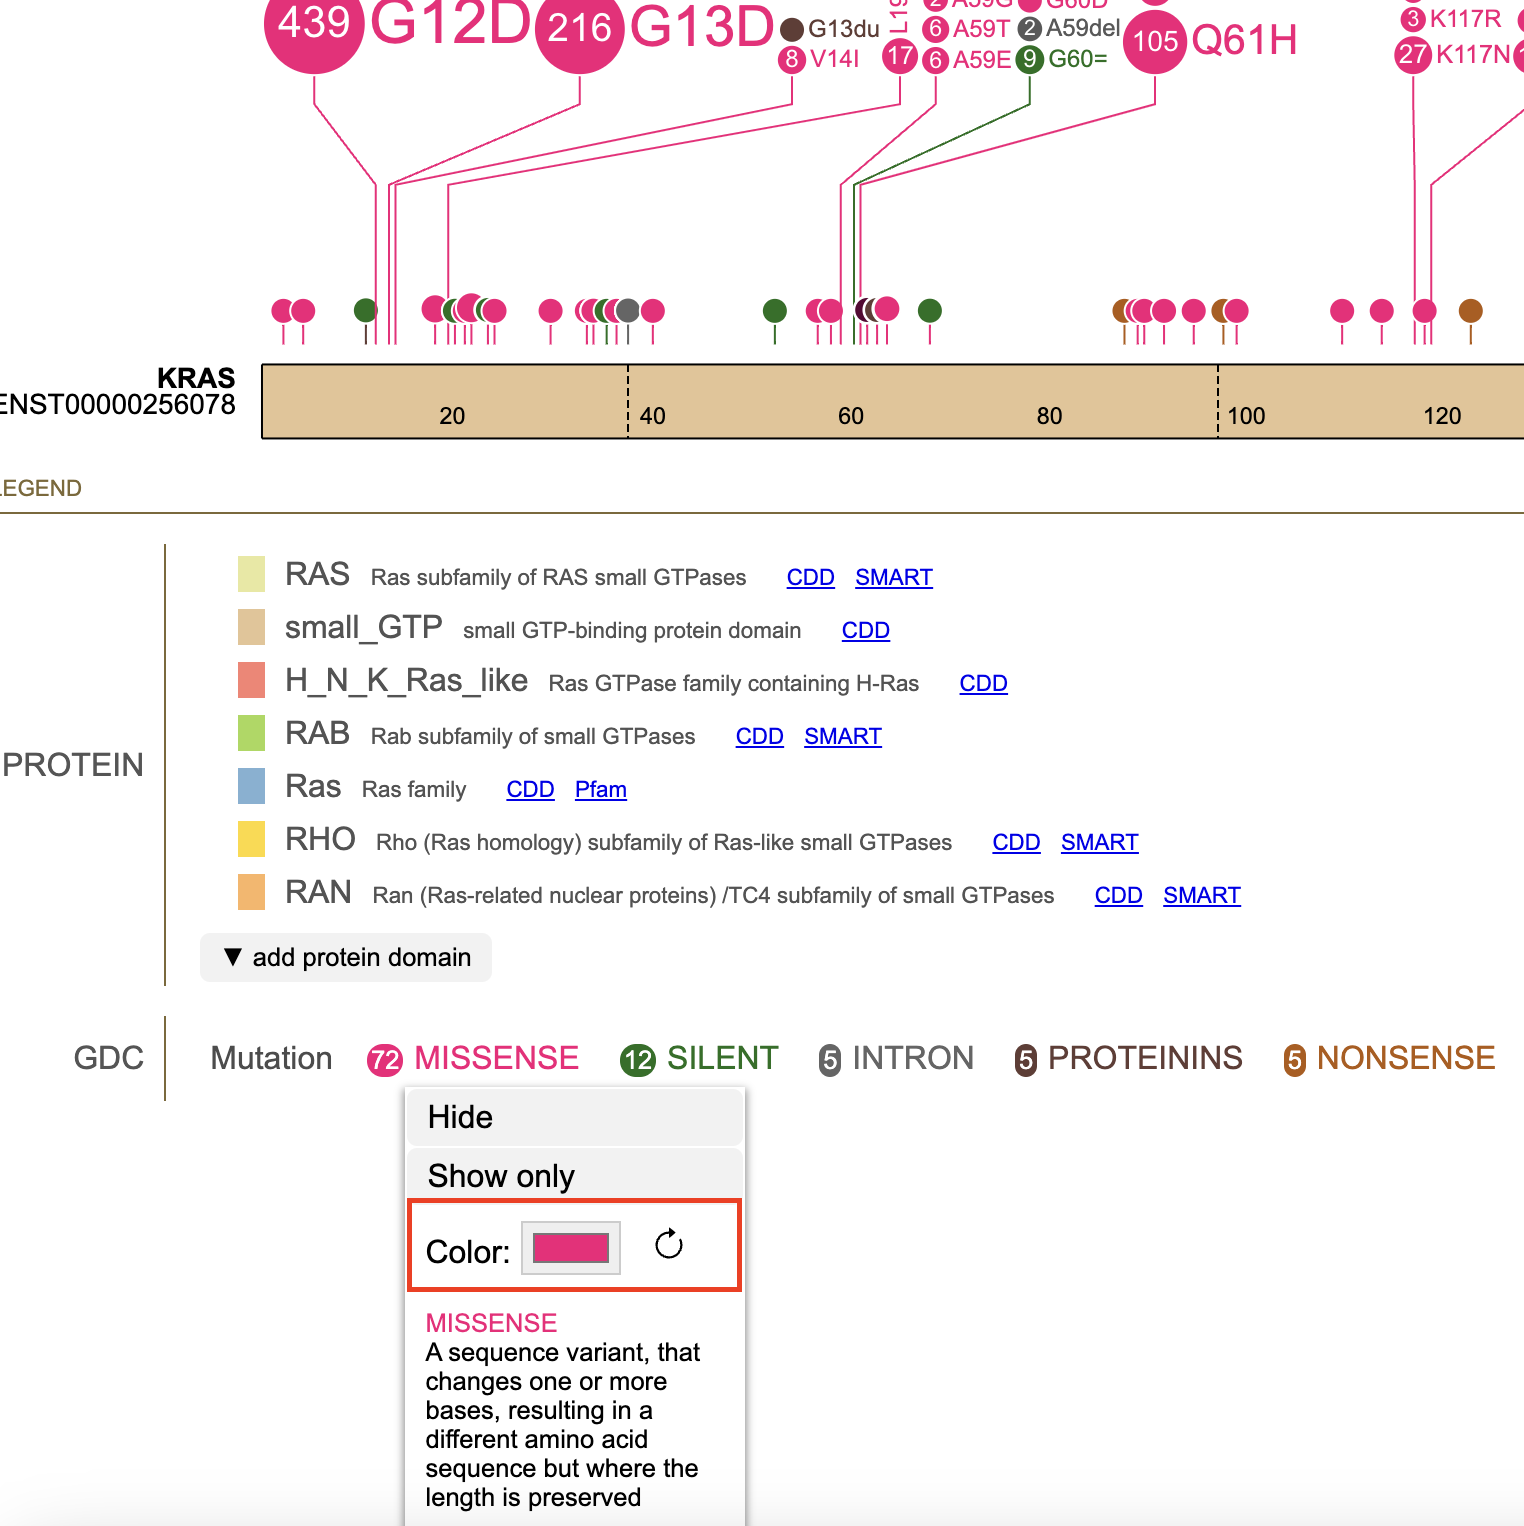
The lollipop discs are color coded per GDC mutation classes. The legend for the mutations appears below the protein domains with more advanced show/hide functions.
The classification for the type of variant is color coded.
Clicking on a mutation prompts a pop-up menu to appear with the description of the mutation. Options to 'hide' or 'show only' are specific to the mutation. The option 'show all' includes all previously hidden mutations. Selecting 'MISSENSE' shown in the figure below displays the initial menu with the 'hide' and 'show only' buttons.
Clicking 'Hide' removes all of the mutation discs from the lollipop. The mutation is reordered to the end of the list and the font is striked through and grayed out. The discs reappear when the mutation label is clicked again.
The color selector in the pop-up menu allows users to customize consequence colors. Once a custom color is selected, the consequence will be rendered in that color, and a clockwise icon will be shown next to the color selector. Clicking the icon will restore consequence color to default.
More Options
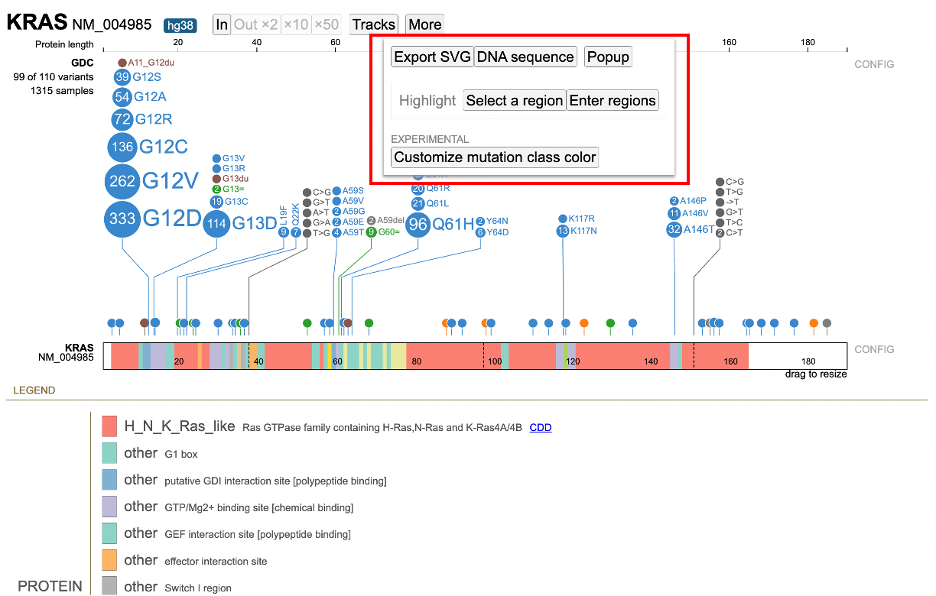
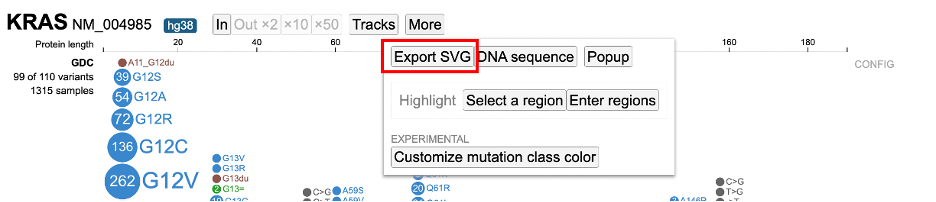
ProteinPaint offers methods to download figures and data. Click the 'More' button in the toolbar to display various options as shown below.
Exporting the Figure
Click "Export SVG" to download the lollipop and legend as an SVG file.
The exported figure will contain following contents, reflecting a user's customization: * Displayed datasets, including custom data * Expand/fold states of all mutations * Sequences in the protein if at zoom-in level * Show/hide state of exon boundaries * Sunburst charts * Protein domains without the hidden ones * All mutations without the hidden classes or origins * Legend for protein domain, mutation class and origin
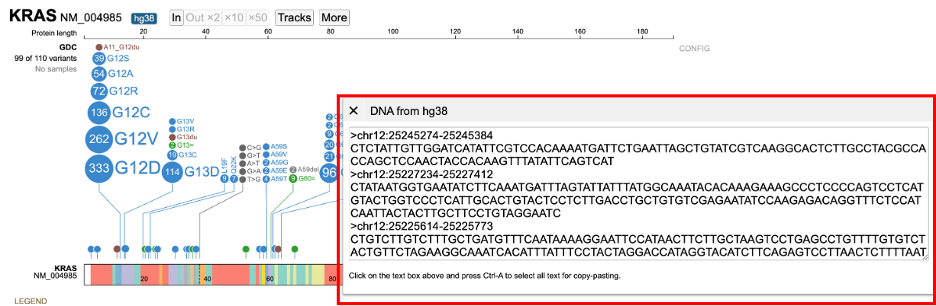
Copying the DNA Sequence
The 'More' button also includes a 'DNA sequence' button.
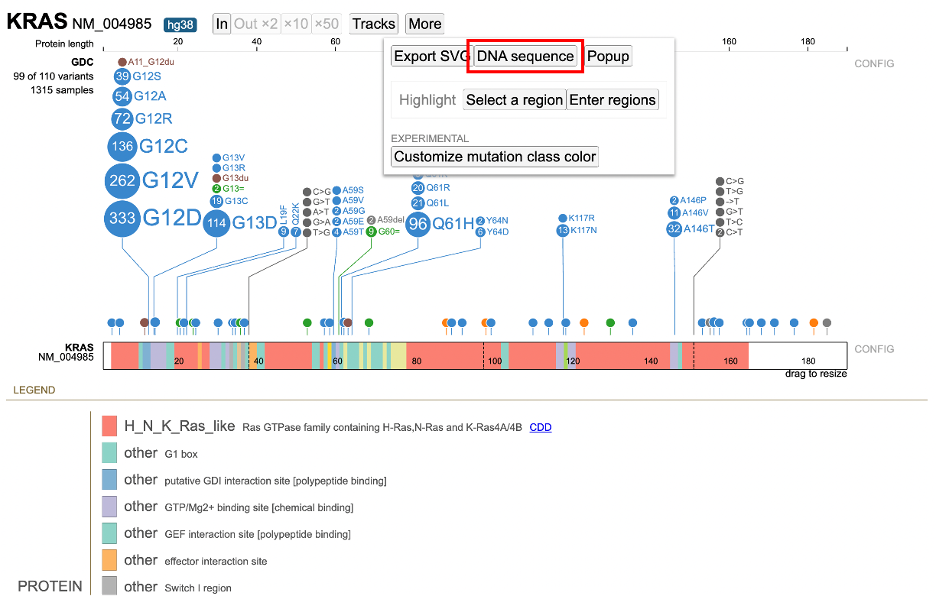
Clicking on 'DNA sequence' displays the DNA sequence as plain text for easy copying and pasting.
Popup Option
The pop up option under the More button allows for popping open another window with the same lollipop display selected by the user. Below is an example.