Projects
At a high level, data in the Genomic Data Commons is organized by project. Typically, a project is a specific effort to look at particular type(s) of cancer undertaken as part of a larger cancer research program. The GDC Data Portal allows users to access aggregate project-level information via the Projects Page and Project Summary Pages.
Projects Page
The Projects Page provides an overview of all harmonized data available in the Genomic Data Commons, organized by project. It also provides filtering, navigation, and advanced visualization features that allow users to identify and browse projects of interest. Users can access the Projects Page from the GDC Data Portal Home page or from the Data Portal toolbar.
On the left, a panel of facets allow users to apply filters to find projects of interest. When facet filters are applied, the table and visualizations on the right are updated to display only the matching projects. When no filters are applied, all projects are displayed.
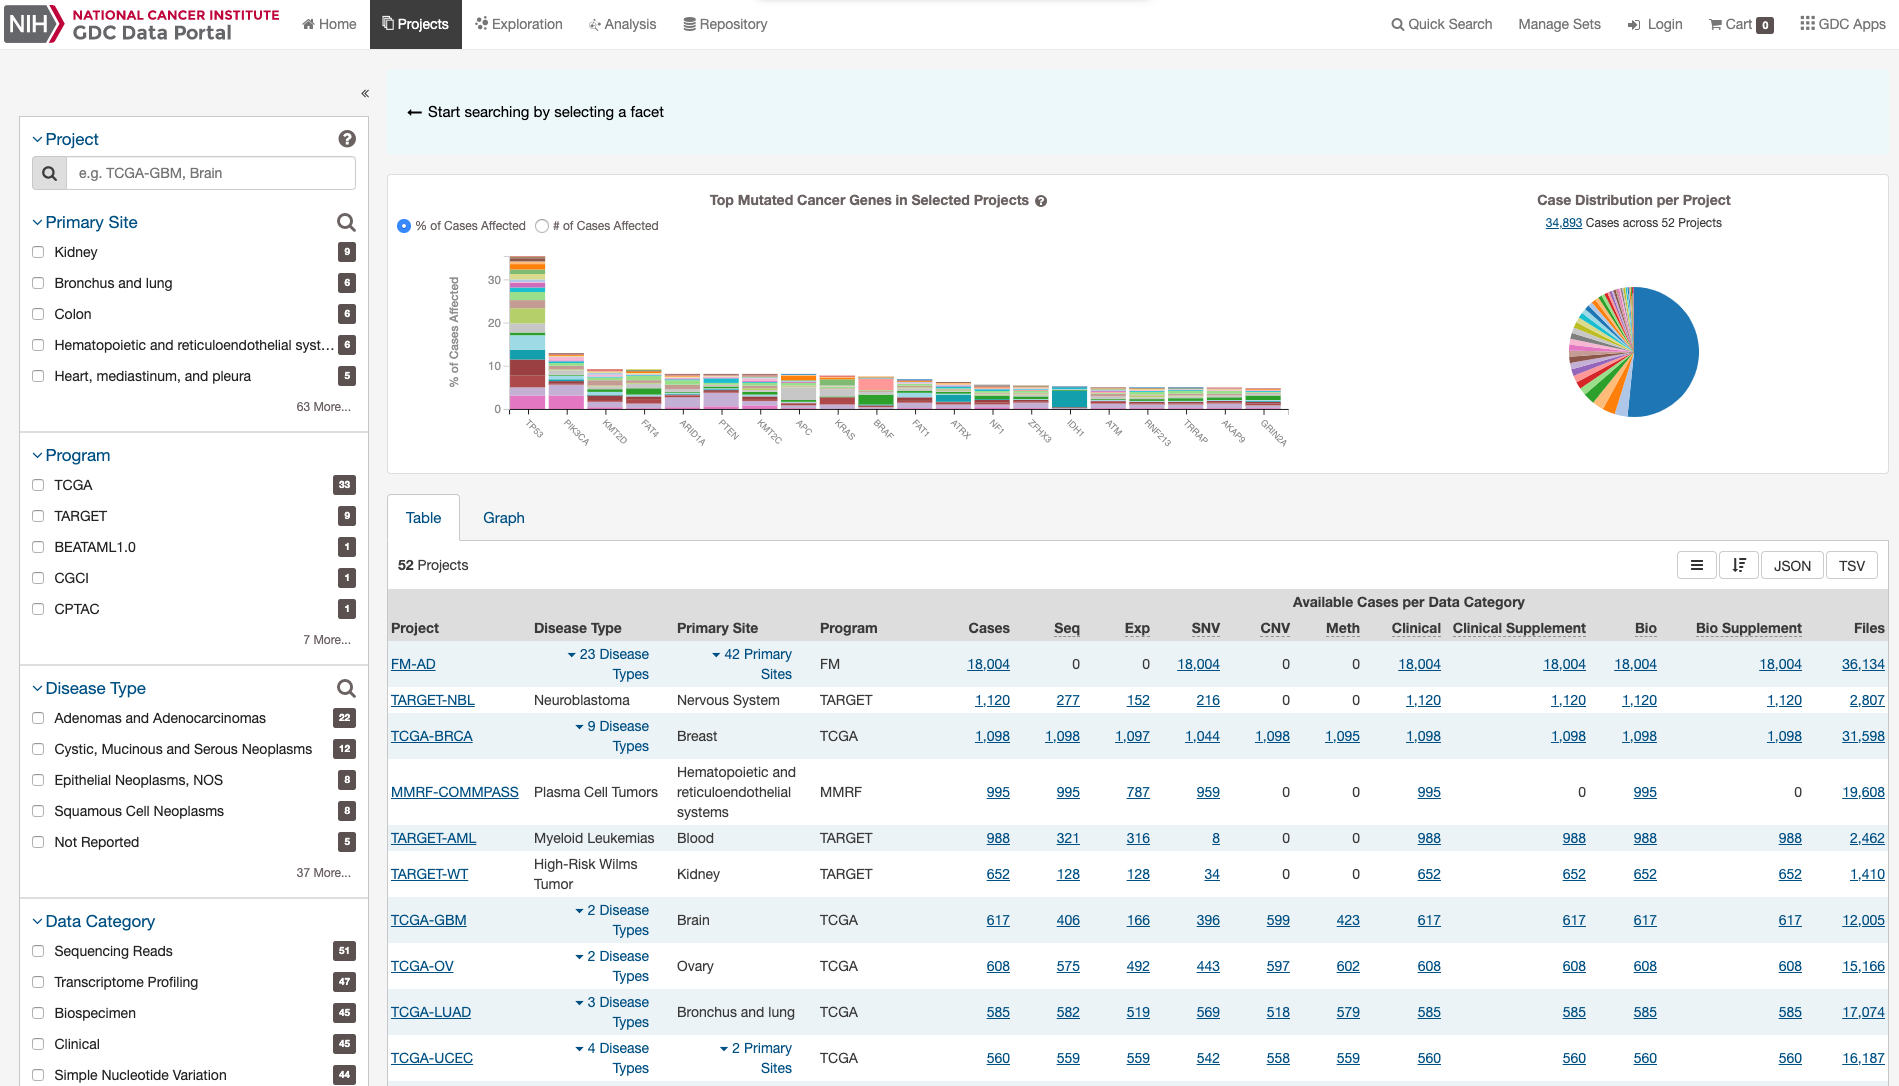
The right side of the Projects Page displays a few visualizations of the data (Top Mutated Genes in Selected Projects and Case Distribution per Project). Below these graphs is a table that contains a list of projects and select details about each project, such as the number of cases and data files. The Graph tab provides a visual representation of this information.
Visualizations
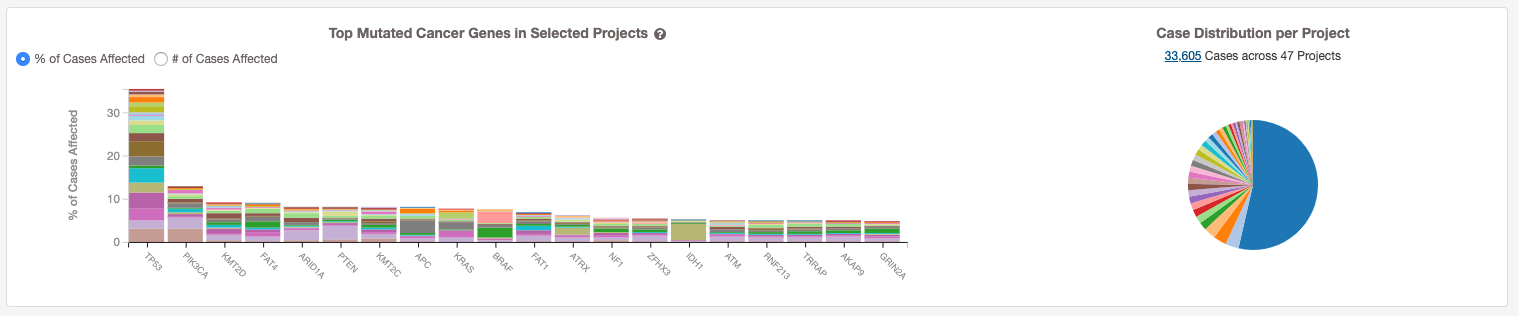
Top Mutated Cancer Genes in Selected Projects
This dynamically generated bar graph shows the 20 genes with the most mutations across all projects. The genes are filtered by those that are part of the Cancer Gene Census and that have the following types of mutations: missense_variant, frameshift_variant, start_lost, stop_lost, initiator_codon_variant, and stop_gained. The bars represent the frequency of mutations per gene and is broken down into different colored segments by project. The graphic is updated as filters are applied for projects, programs, disease types, and data categories available in the project.
Note: Due to these filters, the number of cases displayed here will be less that the total number of cases per project.
Hovering the cursor over each bar will display information about the number of cases affected by the disease type and clicking on each bar will launch the Gene Summary Page for the gene associated with the mutation.
Users can toggle the Y-Axis of this bar graph between a percentage or raw number of cases affected.
Case Distribution per Project
A pie chart displays the relative number of cases for each project. Hovering the cursor over each portion of the graph will display the project with the number of associated cases. Filtering projects at the left panel will update the pie chart.
Projects Table
The Table tab lists projects by Project ID and provides additional information about each project. If no facet filters have been applied, the table will display all available projects; otherwise it will display only those projects that match the selected criteria.
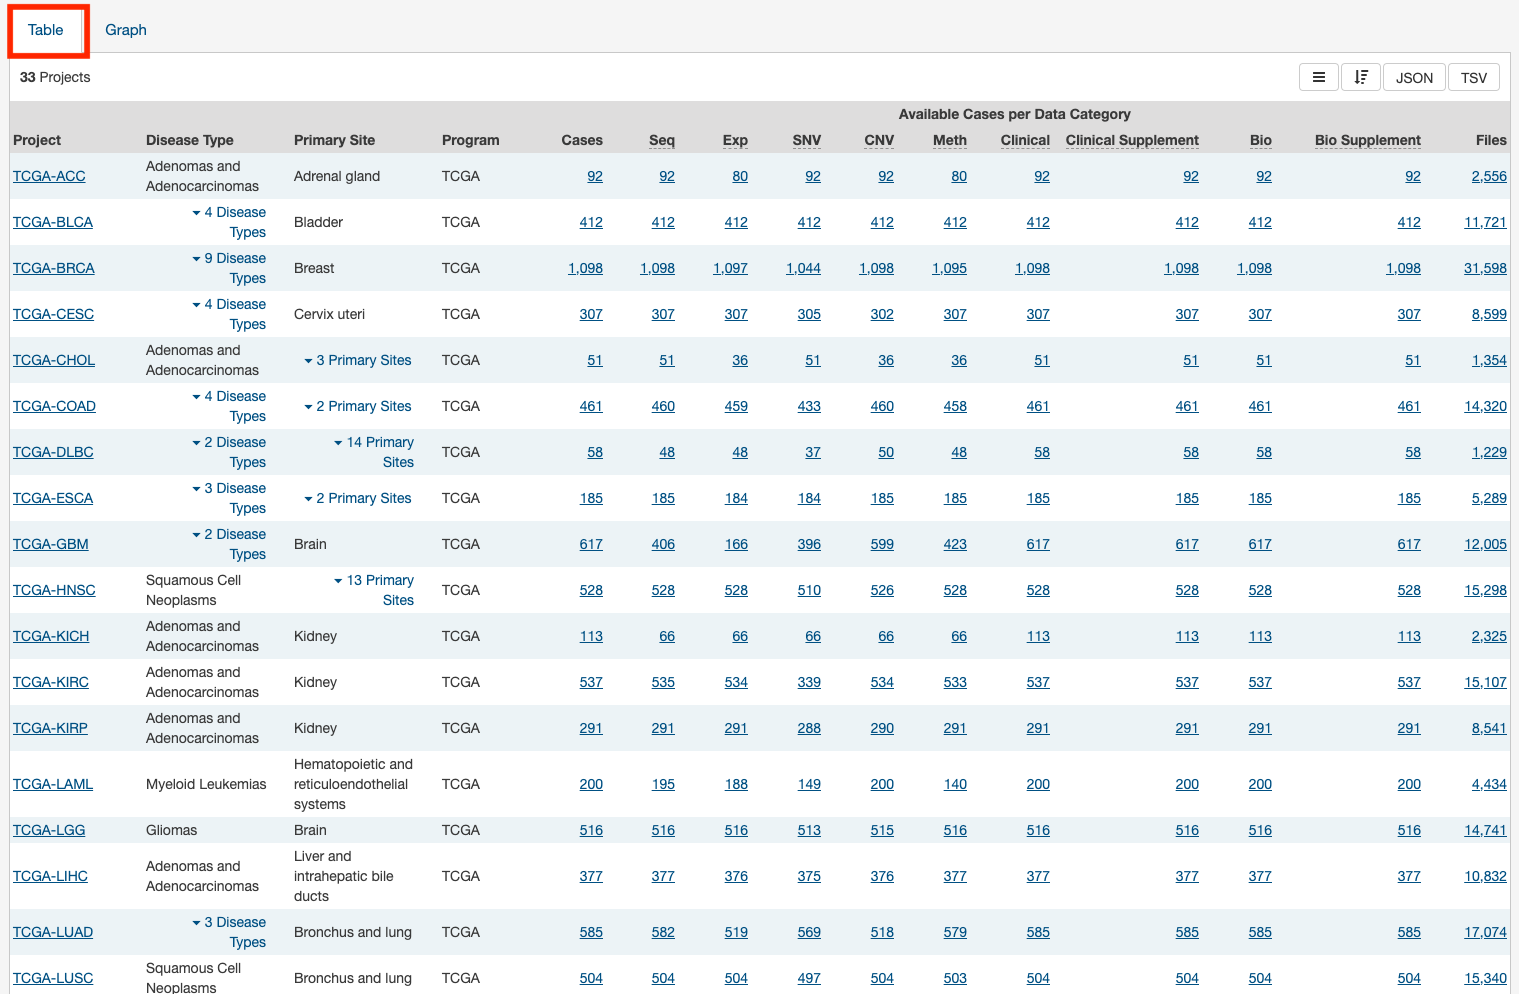
The table provides links to Project Summary Pages in the Project ID column. Columns with file and case counts include links to open the corresponding files or cases in Repository Page.
Projects Graph
The Graph tab contains an interactive view of information in the Table tab. The numerical values in Case Count, File Count, and File Size columns are represented by bars of varying length according to size. These columns are sorted independently in descending order. Mousing over an element of the graph connects it to associated elements in other columns, including Project ID and major Primary Sites.
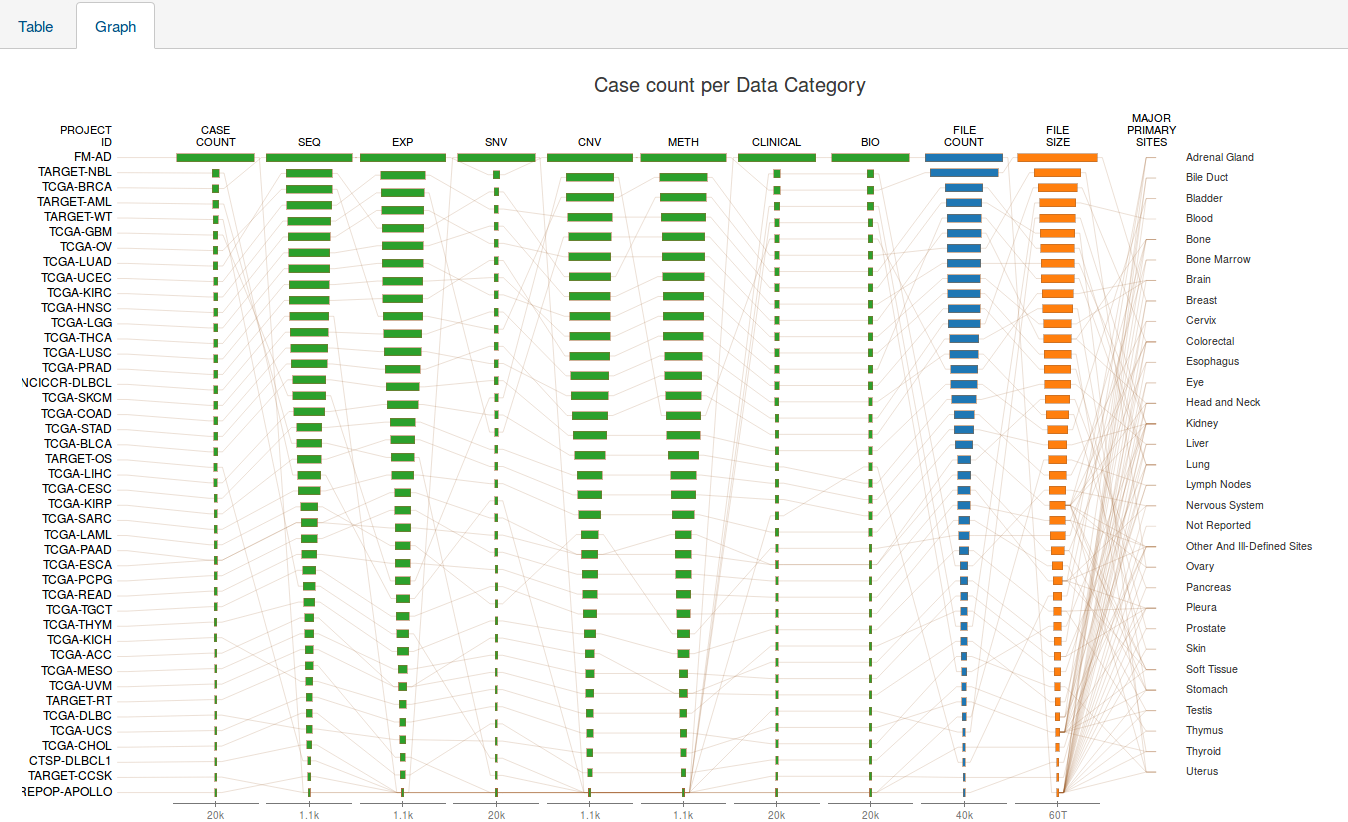
Most elements in the graph are clickable, allowing the user to open the associated cases or files in Repository Page.
Like the projects table, the graph will reflect any applied facet filters.
Facets Panel
Facets represent properties of the data that can be used for filtering. The facets panel on the left allows users to filter the projects presented in the Table and Graph tabs as well as visualizations.
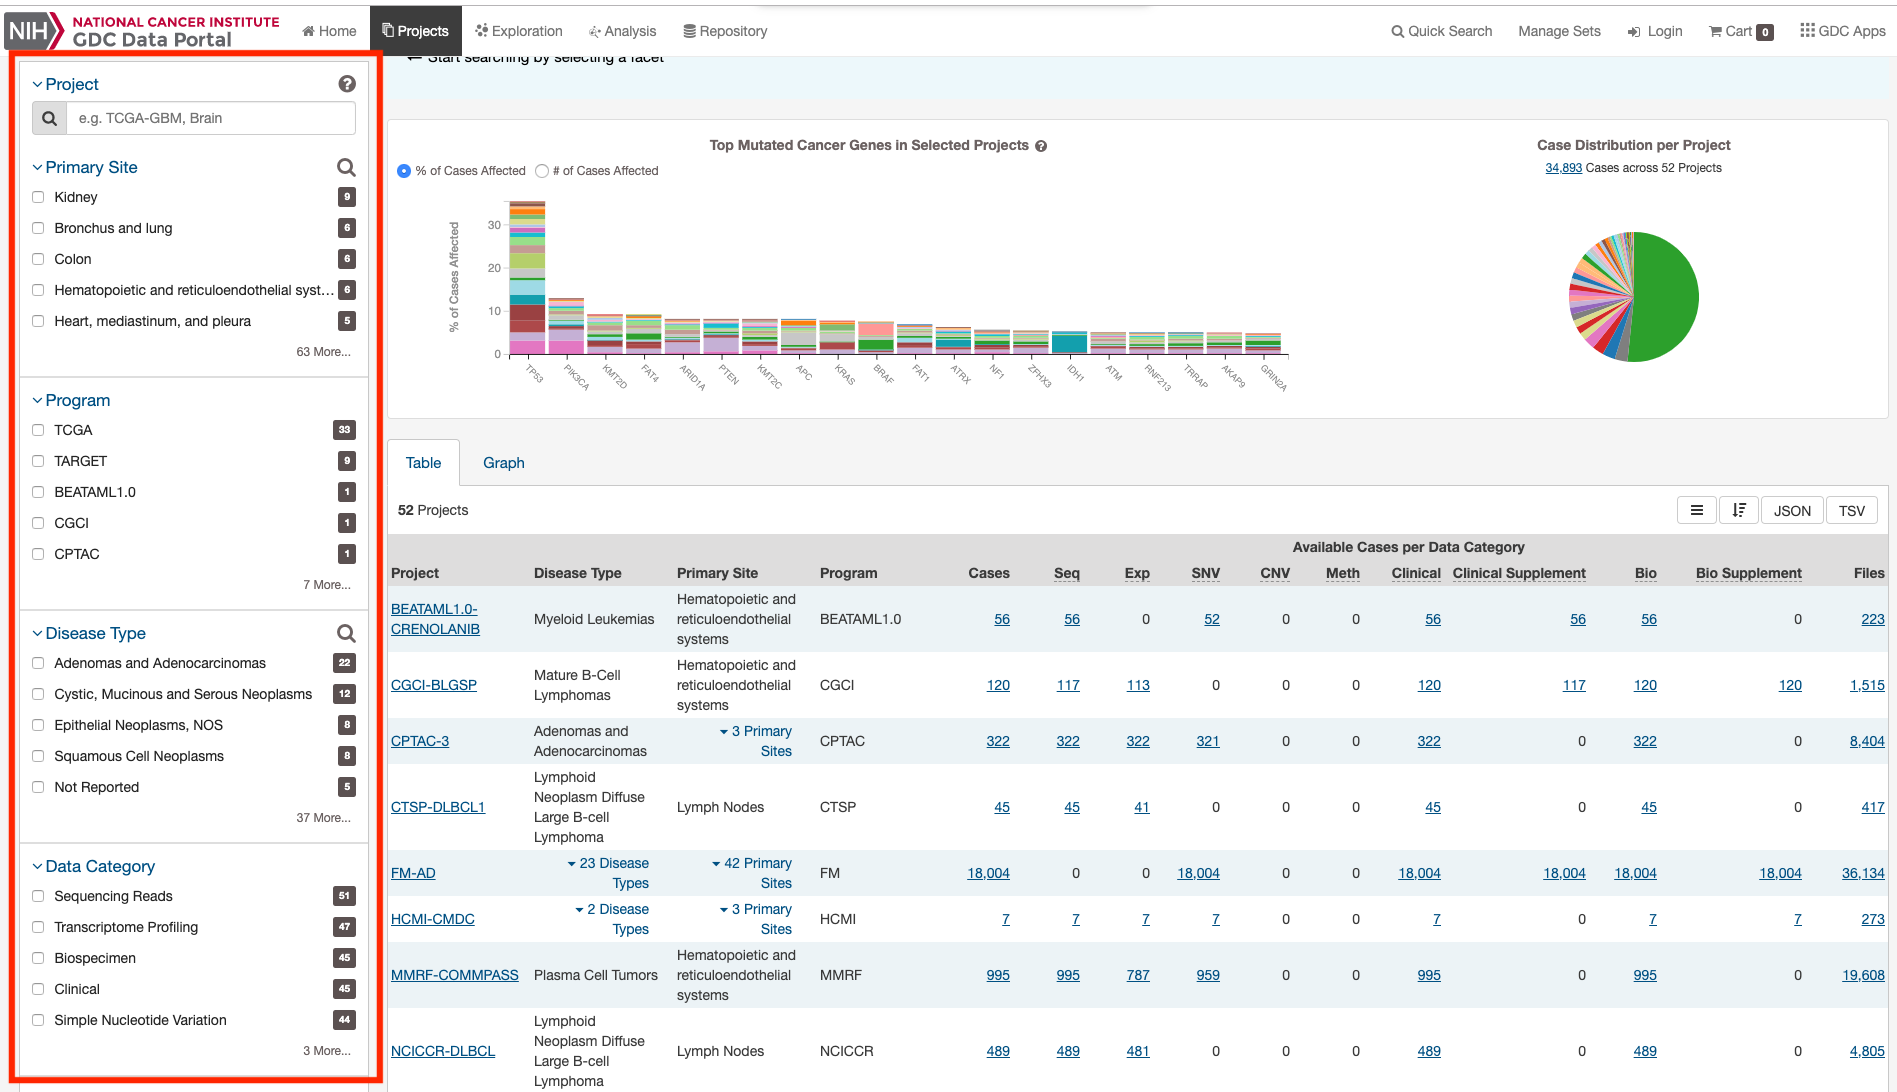
Users can filter by the following facets:
- Project: Individual project ID.
- Primary Site: Anatomical site of the cancer under investigation or review.
- Program: Research program that the project is part of.
- Disease Type: Type of cancer studied.
- Data Category: Type of data available in the project.
- Experimental Strategy: Experimental strategies used for molecular characterization of the cancer.
Filters can be applied by selecting values of interest in the available facets, for example "WXS" and "RNA-Seq" in the "Experimental Strategy" facet and "Brain" in the "Primary Site" facet. When facet filters are applied, the Table and Graph tabs are updated to display matching projects, and the banner above the tabs summarizes the applied filters. The banner allows the user to click on filter elements to remove the associated filters and includes a link to view the matching cases and files.

For information on how to use facet filters, see Getting Started.
Project Summary Page
Each project has a Summary Page that provides an overview of all available cases, files, and annotations available. Clicking on the numbers in the summary table will display the corresponding data.
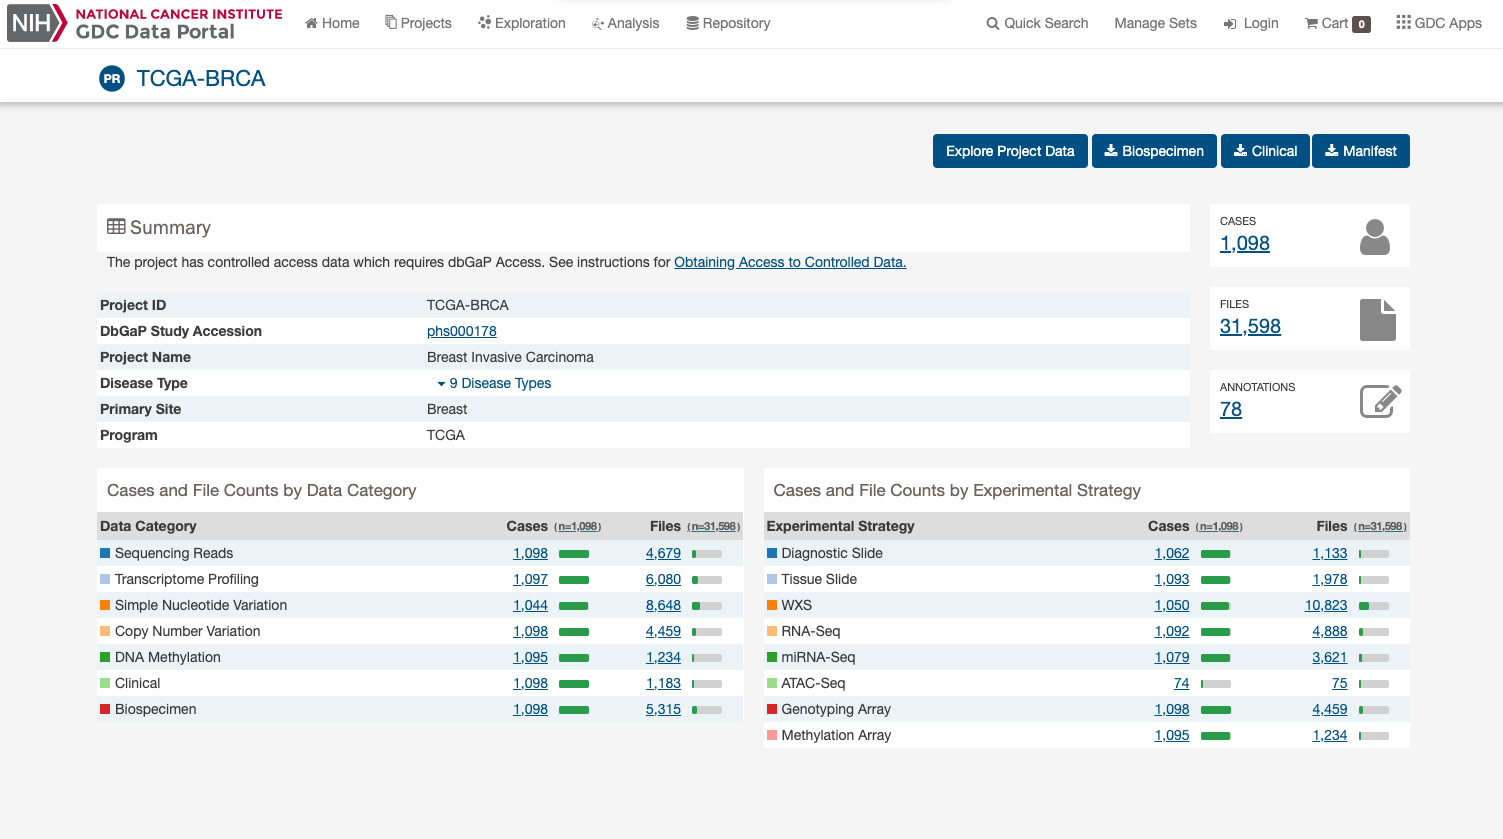
Four buttons in the top right corner of the screen allow the user to explore or download the entire project dataset, along with the associated project metadata:
- Explore Project Data: Opens Exploration Page with summary project information.
- Biospecimen: Downloads biospecimen metadata associated with all cases in the project in either TSV or JSON format.
- Clinical: Downloads clinical metadata about all cases in the project in either TSV or JSON format.
- Manifest: Downloads a manifest for all data files available in the project. The manifest can be used with the GDC Data Transfer Tool to download the files.